Data analysis trends in Excel
In today's data-driven world, the ability to uncover trends and patterns hidden within data can be a game-changer for businesses and individuals alike. At XL Intelligence, we understand the significance of data analysis trends in Excel and have made it our mission to help our clients harness the power of this versatile tool. In this article, we will explore the evolving landscape of data analysis with Excel and dive into the techniques and methods that can help you uncover valuable insights.
Key Trends in Data Analysis with Excel
The Importance of Data Analysis Trends in Excel
Data analysis is a dynamic field, and staying updated with the latest trends is crucial. As Excel enthusiasts, we recognise the importance of keeping pace with emerging trends in data analysis. Whether it's new features within Excel or innovative data analysis methods, staying informed is the key to success.
XL Intelligence's Commitment
At XL Intelligence, we take pride in our dedication to following data analysis trends. We invest in continuous learning and keep a keen eye on industry developments to provide our clients with the most up-to-date solutions. We understand that to be the best, you must stay ahead.
Excel as a Versatile Data Analysis Tool
The Power of Microsoft Excel
Microsoft Excel is more than just a spreadsheet program; it's a versatile data analysis tool. With its user-friendly interface and extensive functionalities, Excel is accessible to both beginners and experts. Our team at XL Intelligence believes in leveraging this power to the fullest.
Excel's Features for Data Analysis
From data cleansing and transformation to complex calculations, Excel offers an array of features to facilitate data analysis. Whether you need to summarise data, identify trends, or create insightful visualisations, Excel has got you covered. Our proficiency in utilising these features sets us apart.
Data Visualisation and Trend Identification in Excel
The Role of Data Visualisation
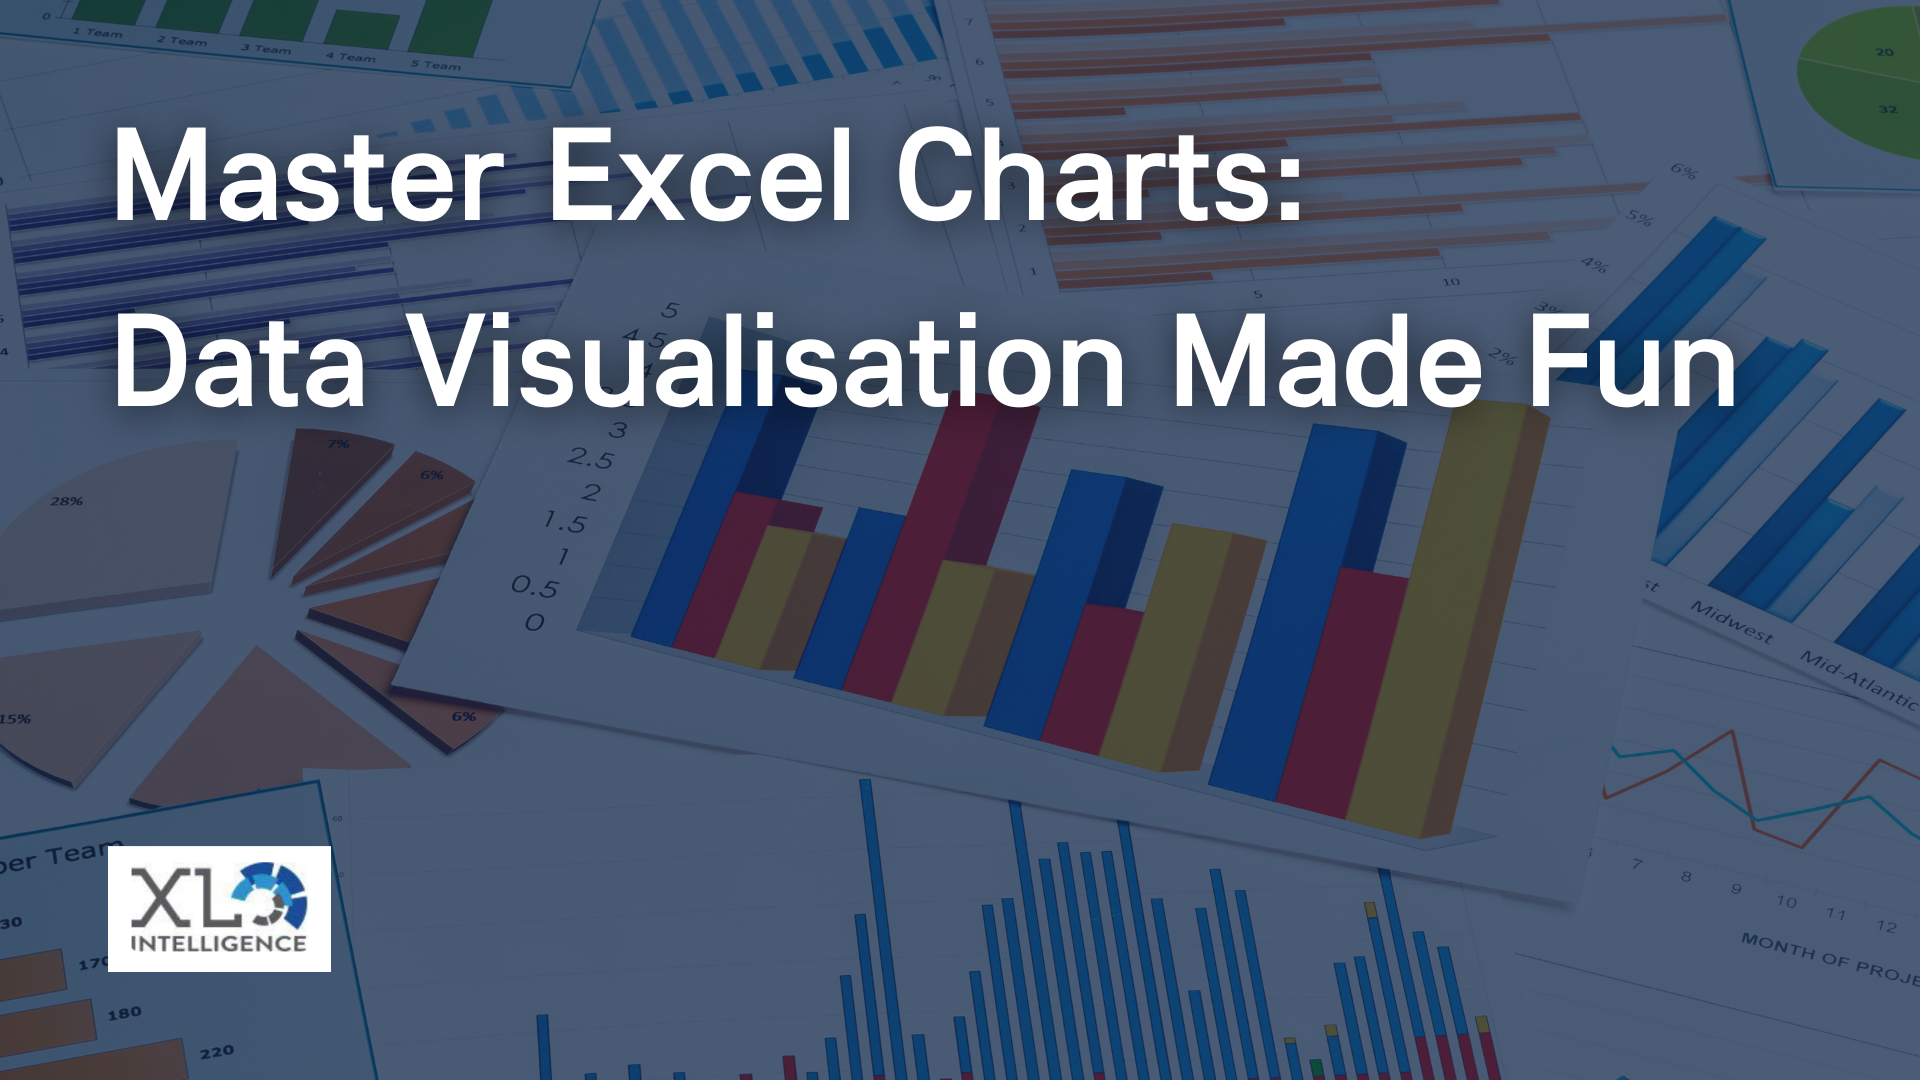
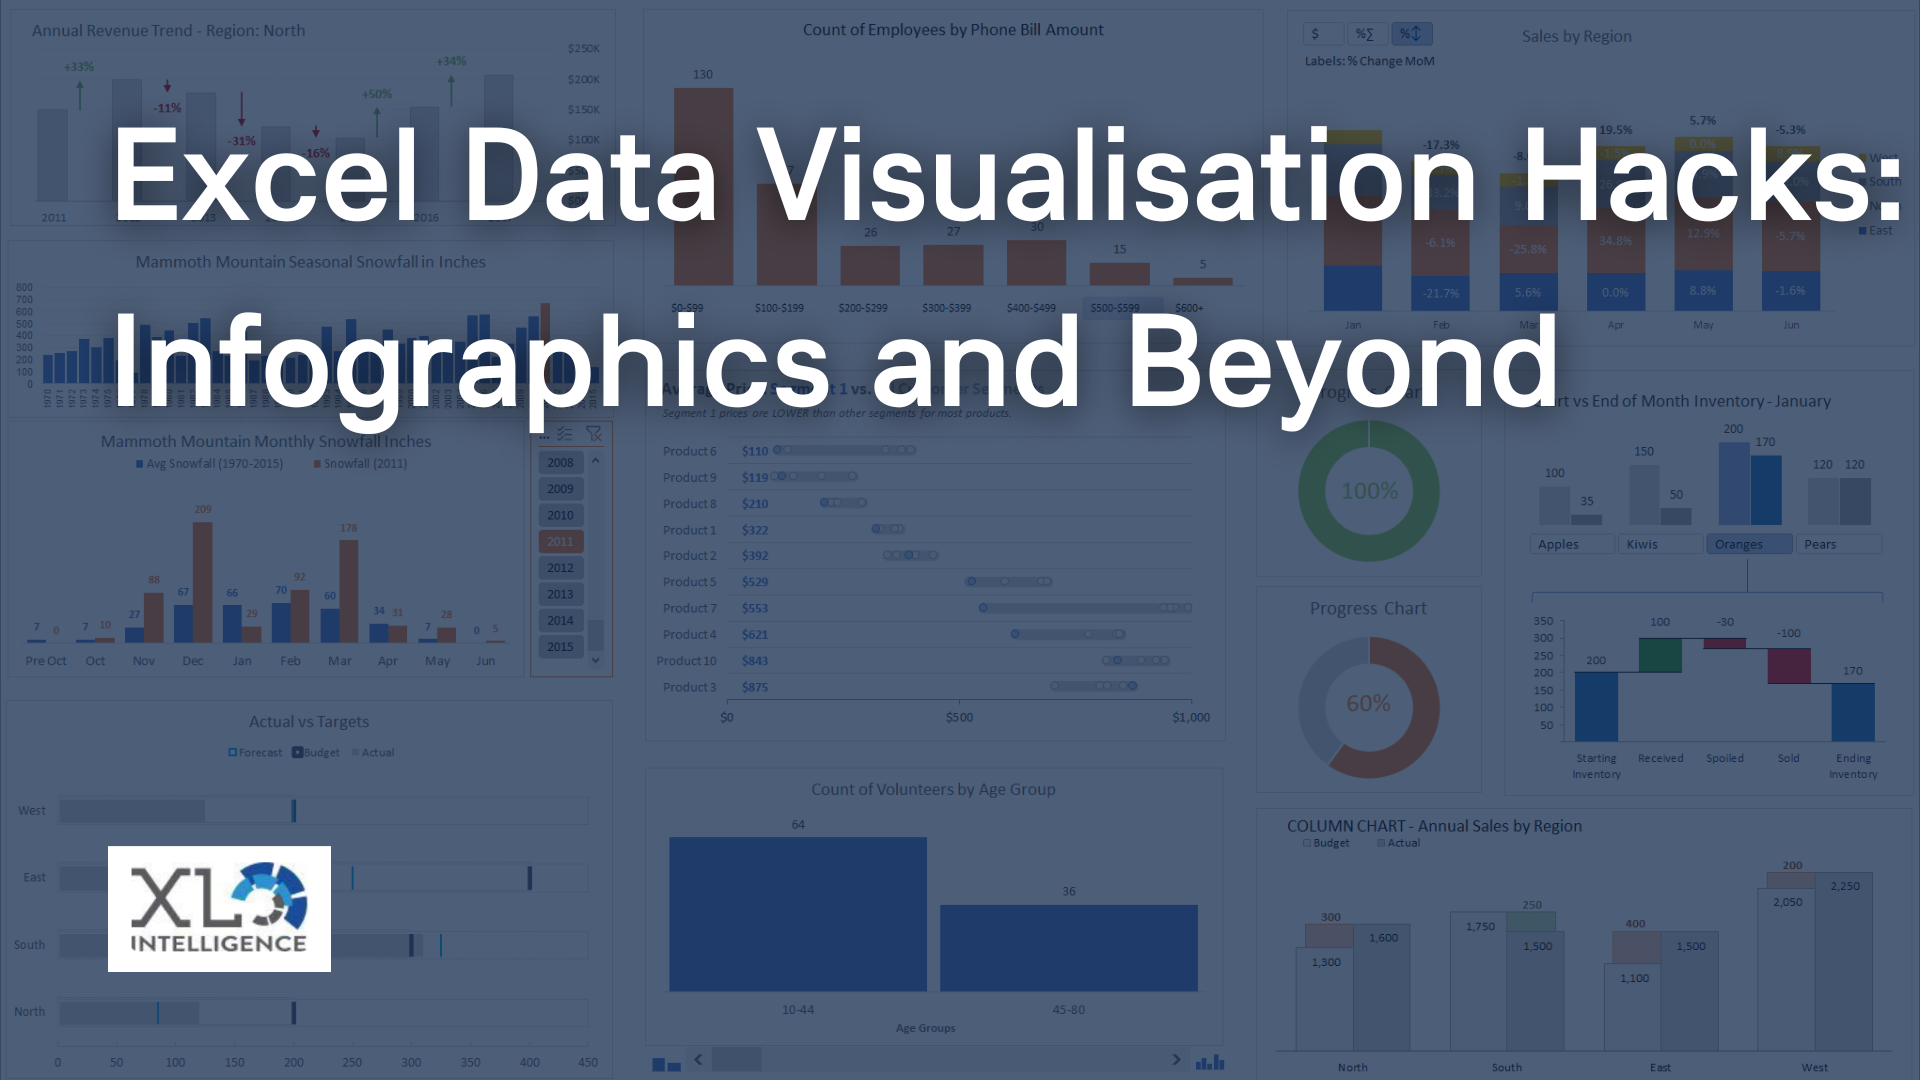
Visualisation plays a pivotal role in spotting trends within datasets. At XL Intelligence, we understand that a well-crafted chart or graph can make all the difference. Excel offers a variety of options to create compelling data visualisations that can help you identify trends at a glance.
Real-World Example
To illustrate the power of data visualisation in Excel, I recall a client project we handled recently. They had a vast amount of sales data spanning several years. By creating a series of interactive charts and graphs, we helped them identify a significant upward trend in sales during the holiday season. This insight allowed our client to allocate resources more effectively and maximise their profits during the festive period.
Advanced Techniques for Trend and Pattern Analysis
Unleash Excel's Potential
Excel offers advanced techniques for in-depth trend analysis. PivotTables, Power Query, and various statistical functions can take your data analysis to the next level. At XL Intelligence, we're well-versed in these advanced methods and can help you unlock the full potential of Excel.
XL Intelligence's Expertise
Our team's expertise lies in implementing advanced Excel data analysis methods. We've used these techniques to uncover hidden patterns and trends for numerous clients, resulting in significant improvements in their decision-making processes and business strategies.
Staying Ahead in Data Analysis Trends with XL Intelligence
Key Takeaways
In summary, staying updated with data analysis trends in Excel is vital for success in today's data-driven world. XL Intelligence is here to help you:
- Understand the importance of data analysis trends in Excel.
- Harness the versatility of Excel for data analysis.
- Embrace data visualisation for trend identification.
- Explore advanced techniques for in-depth trend and pattern analysis.
- Learn from real-life case studies of trend discovery.
- Stay ahead of the curve with XL Intelligence's commitment to excellence.
Conclusion
In conclusion, Excel's role in data analysis trends cannot be underestimated. The ability to uncover valuable trends and patterns within your data can lead to better decision-making, increased efficiency, and a competitive edge. At XL Intelligence, we are passionate about helping our clients achieve these goals using the power of Excel.
If you're looking to make the most of data analysis trends with Excel, don't hesitate to get in touch with us. We're here to assist you in harnessing the full potential of this versatile tool. Contact us today and let XL Intelligence guide you towards a future filled with data-driven insights and success.


