Excel Automation at a Glance
Much like how technology has automated so many arduous and repetitive processes that used to fall on humans over generations, the process of automation extends deeper than we realise. We often forget how, despite the automation opportunities that exist at our fingertips, that we have the ability to convince software we use every day to automate so much more. Microsoft Excel, on one hand requires a lot of care and attention and can eat up a lot of our time when managing and overseeing business processes, but we can automate considerable amounts to save ourselves repeating the same monotonous processes again and again.
Microsoft Excel has macro functions which allow users to automate entire spreadsheets, so users can save themselves entering information repeatedly. You can create algorithms that automate the data entry and extraction processes and end up with lovely charts and graphs that detail your statistics, construct emails to clients or staff and add variations along the way. Excel Automation software and the training courses on hand both serve to reduce and eliminate mistakes, automate Excel reports and integrate Excel with other data sources and applications.
Data Visualisation
Data visualisation is the representation of data in a visual format. It involves producing images (such as charts and graphs) that communicate relationships between data to make it easier to see and understand, which in turn can ease the process of recognising trends and patterns.
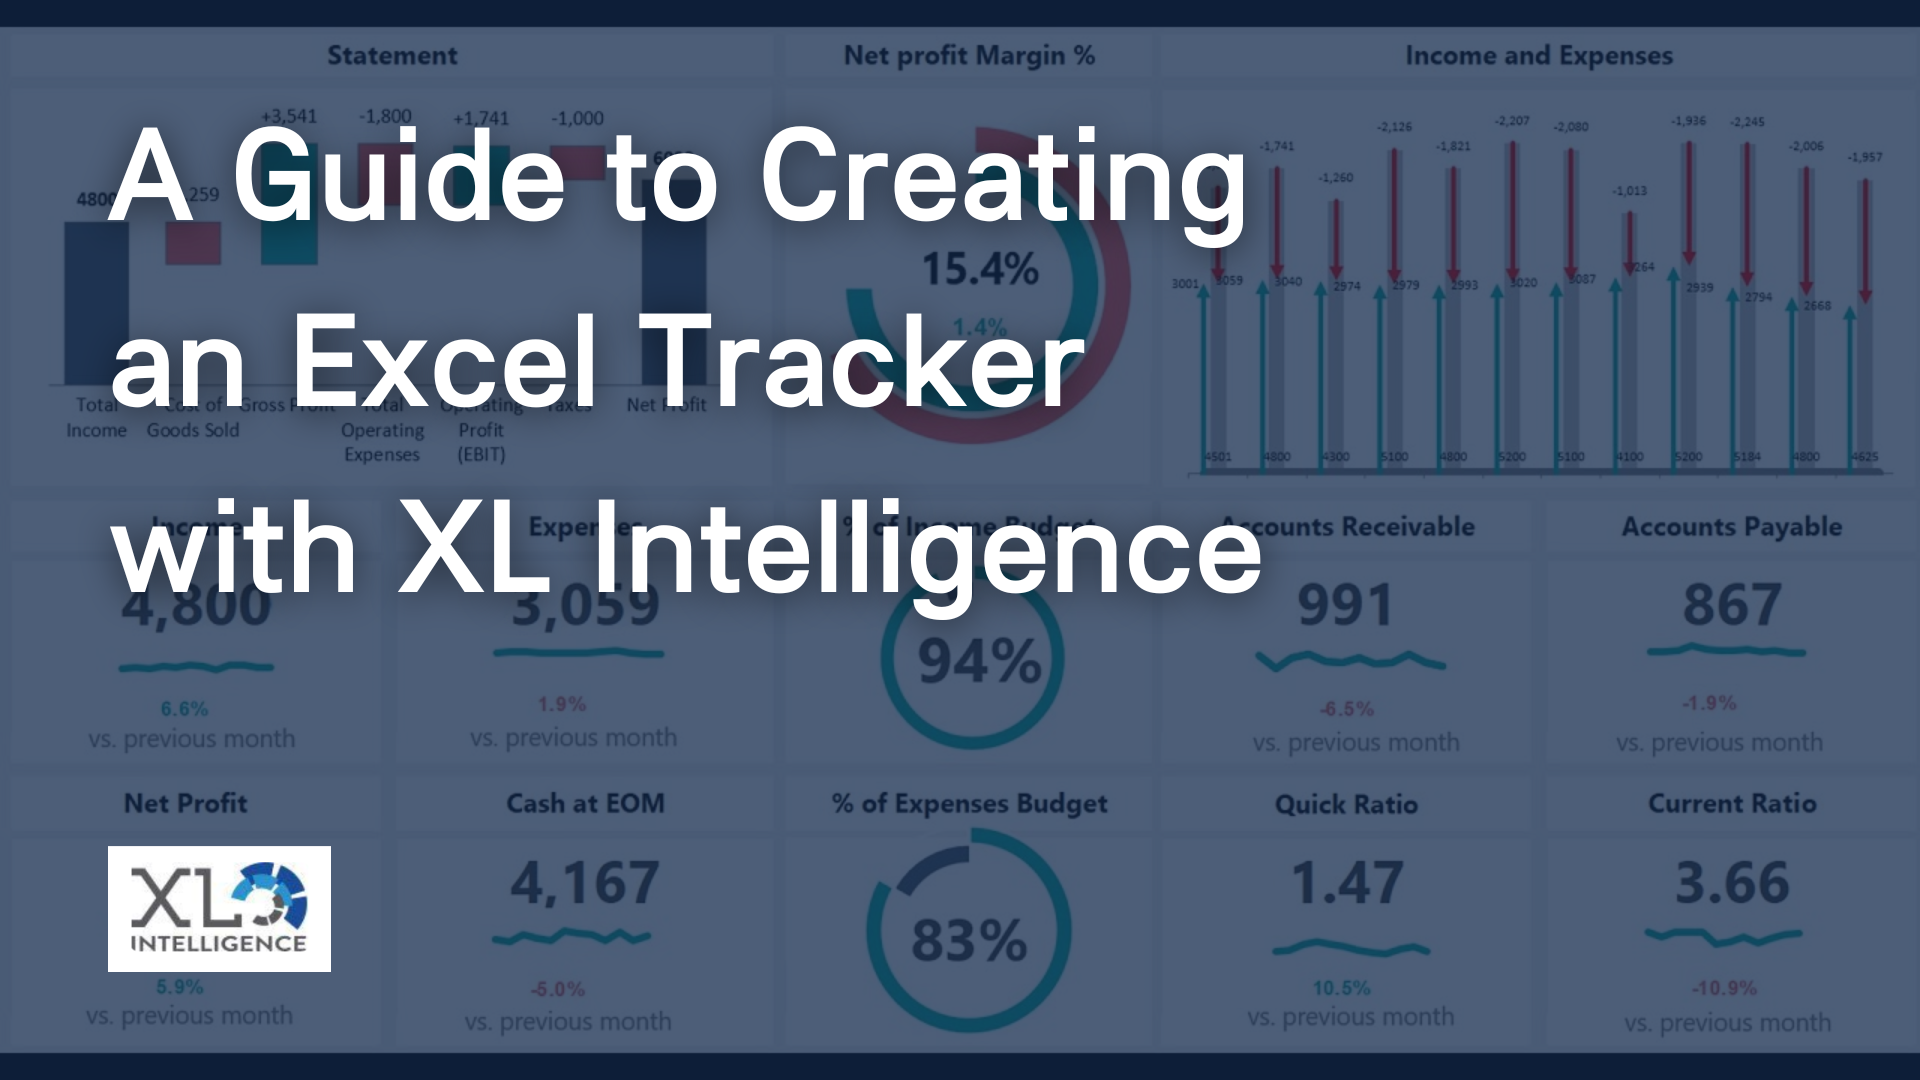
Data without analysis or any form of presentable visual element is, in a sense, meaningless. Excel has tools at hand to create dashboards that can provide insights and presentable images that display your data in a simple method and in a very timely manner. Excel has little to no restrictions on the user’s ability to create dashboards that are ideal for their business environments.
Luckily, Excel also has the ability to automate almost every manual function that be completed. Here, we look at one particular client who wanted visual representation of huge amounts of data in the form of dashboards, charts and summaries so they could be easily understood.
Did you know?
You cannot name a sheet “History”.
You will get an error saying that this name is reserved. Why? Have you ever tried to create a shared workbook and track changes in Excel? If you’d like to see who did what, when and where, Excel will create a new sheet for you with the name… Yes – you guessed it – History. There you will be able to see who and when made the changes and in which ranges. If only it can also tell you WHY?
A Client’s Experience
In 2016, XL Intelligence took on a client, a multinational pharmaceutical company, who were on the lookout for an automated solution that required implementation of data visualisation techniques.
Problem:
In summary, the Human Resources department advertised for new roles within the company and completed the hiring process within a period of 60-90 days from the day of advertising. They kept track of all interviews, the percentages of internal references, staff retention/satisfaction levels amongst other metrics, and naturally had several KPIs to hit and restrictions to adhere to.
Once a year, the department received survey results – in excess of 45 XLS and CSV files – with thousands of records on each, and the aim was to automate the data to be converted into charts, totals and ultimately be displayed on a screen, that easily shows the progress and separations of the specific data.
In short, the company in question was struggling to cope with manually extracting thousands of records, often taking days at a time to complete. Concurrently, adhering to strict timeframes put more pressure on the situation.
Solution:
XL Intelligence’s solution, as a result of their Excel consulting services was to successfully automate this company’s data processing strategy and create a dashboard with custom built charts which compared the target range and current performance against each other.
The dashboard was crafted in Microsoft Excel, and through VBA coding, macros and visual controls, the Action Buttons that were created allowed for simple commands to generate PDFs or PowerPoint documents of reports.
Outcome:
As a result of this assistance, the company were able to understand the meaning of the information at a glance. The actual data they possessed was easy to compare against their desired targets and this new implementation meant that going forward, the extraction process would be simpler and would take less time.
The company were already familiar with Microsoft Excel and its processes, and this meant that XL Intelligence could purely focus on consulting with their client rather than train more people to be up to speed with automation.
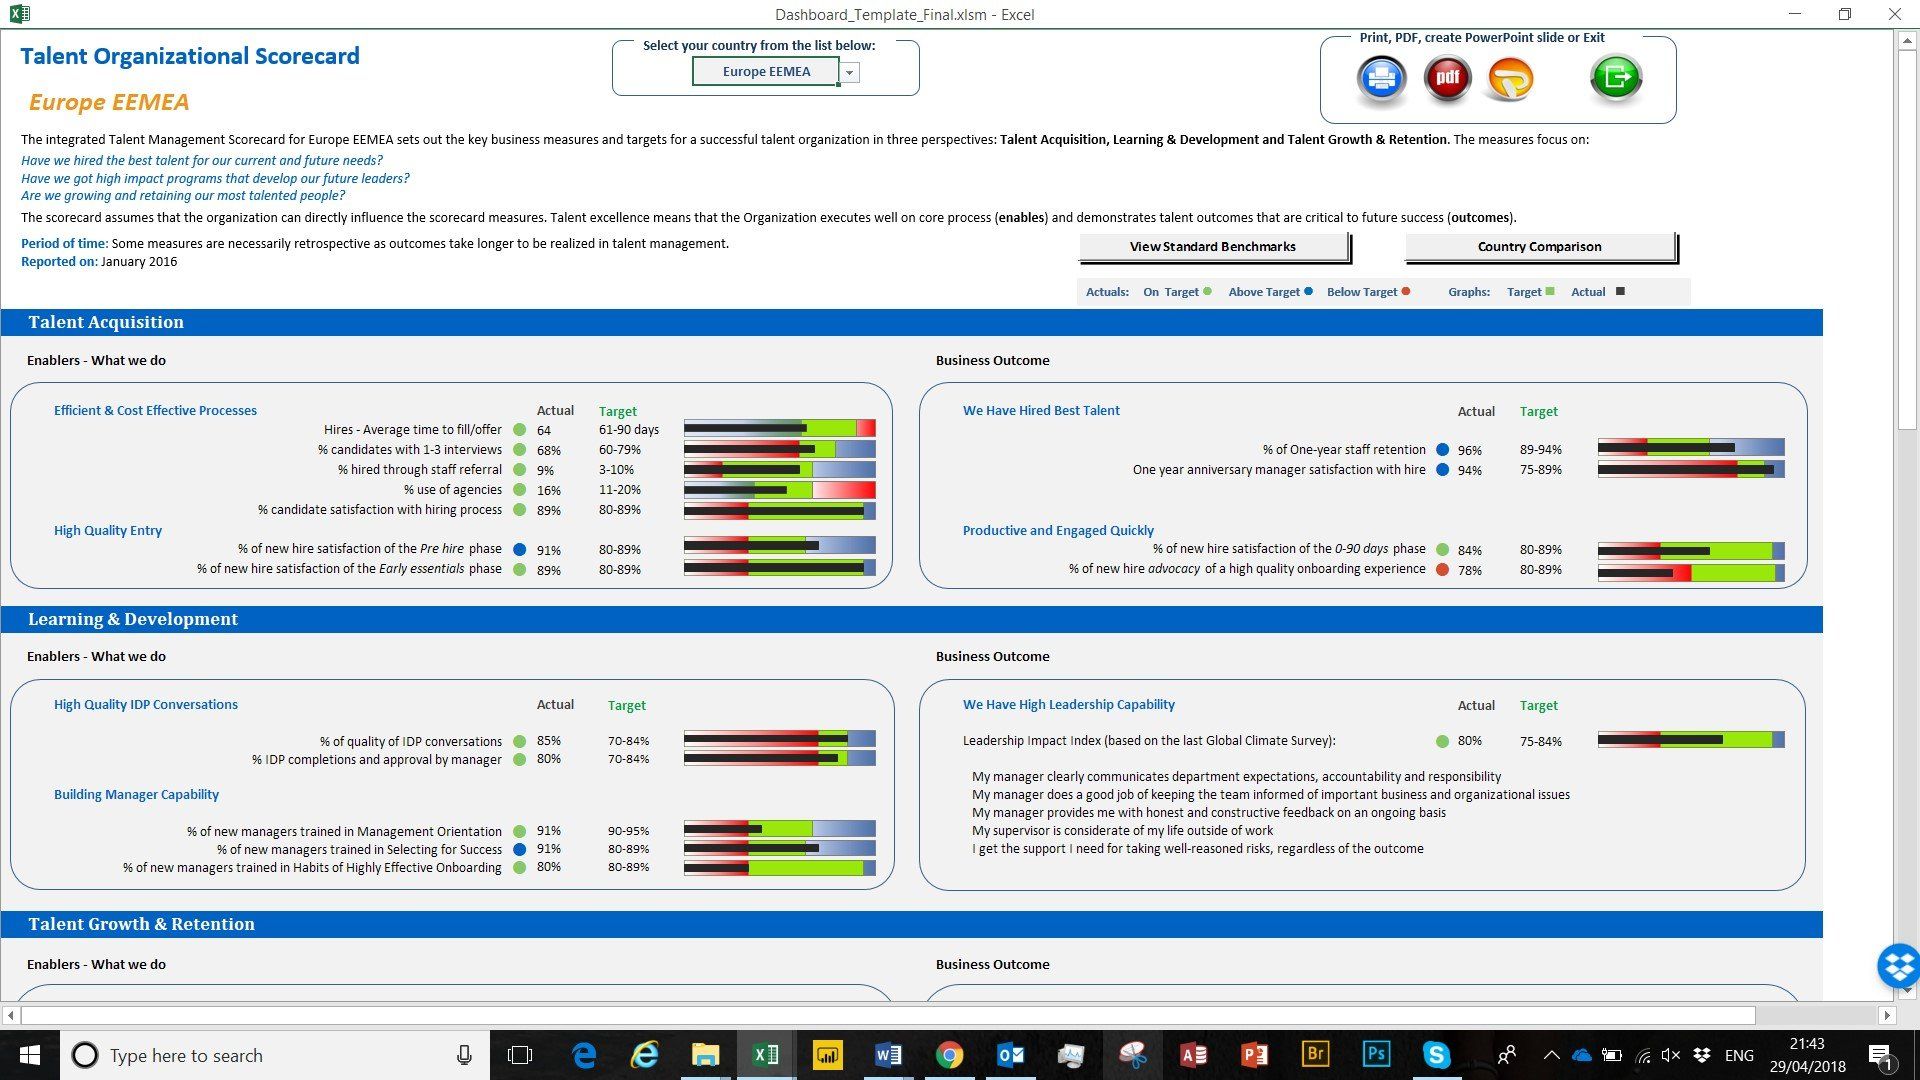
The summaries now take roughly 3 hours to complete, and new custom-built charts are now pre-set within a new template of their spreadsheet. This means that over the course of the coming years, implementing and extracting the data is going to take far less time as a whole.
The whole process also saved on development costs for the company.
How Can XL Intelligence Help Me?
XL Intelligence use Excel Automation and Power BI to create data visualisation and Business Intelligence solutions. You may well find yourself or your business in dire need of some automation when it comes to your data. They also offer advanced VBA training and offer an extensive Power BI training course, both of which can be tailored to your needs.
We recognise that your time is best spent on focusing on big decisions, and not spent on countless hours trawling through seemingly never-ending lists of data. XL Intelligence are specialists in not only training but consulting with you, understanding your business, your processes and your aims. We are experts in crafting specially tailored programs and solutions that will ultimately benefit you in the long run.


