The ability to efficiently manipulate and analyse data is paramount for businesses and individuals alike.

Excel, one of the most widely used spreadsheet applications, offers powerful tools to streamline data processing and derive meaningful insights. Two of these tools, PowerPivot and Power Query, play a crucial role in empowering users to unlock the full potential of their data.
Excel PowerPivot and Power Query are add-ins for Excel that provide advanced data modeling and data transformation capabilities, respectively. These tools enhance Excel's native features, enabling users to work with larger datasets, connect to multiple data sources and perform complex data transformations with ease.
The Benefits of PowerPivot and Power Query
By leveraging PowerPivot and Power Query, users can significantly reduce the time spent on manual data manipulation tasks, allowing them to focus more on data analysis and driving impactful decisions. These tools enable users to:
- Effortlessly Import Data: Power Query simplifies the process of importing data from various sources, such as databases, spreadsheets, web pages, and more. It provides a seamless experience to bring data into Excel, either as separate worksheets or as part of the Excel Data Model.
- Cleanse and Transform Data: Power Query offers an intuitive interface to clean and transform data. Users can remove duplicates, split columns, merge data, apply calculations, and perform a wide range of data manipulations to ensure data quality and consistency.
- Combine Data from Multiple Sources: With Power Query, users can effortlessly combine data from multiple sources into a single dataset. This capability is particularly useful when dealing with data scattered across different files or databases, enabling users to consolidate and integrate data for comprehensive analysis.
Understanding Power Query
Importing Data into Excel
One of the fundamental features of Power Query is its ability to import data into Excel from various sources. Users can connect to databases, online services, files, or even web pages to extract the desired data. Power Query provides a user-friendly interface to guide users through the import process, making it accessible to both beginners and experienced users.
Cleaning and Transforming Data
Once the data is imported, Power Query offers a wide range of data cleansing and transformation options. Users can perform operations such as removing duplicates, splitting columns, filtering rows, and applying calculations to ensure the data is clean and ready for analysis. The intuitive interface allows users to define transformations step-by-step or leverage built-in functions for advanced data manipulations.
Combining Data from Multiple Sources
Power Query excels at integrating data from multiple sources. Whether it's combining data from different Excel files, merging databases, or fetching data from web APIs, Power Query simplifies the process. Users can define relationships between tables, merge data based on common columns, or perform advanced data blending techniques to create a unified dataset for analysis.
Exploring PowerPivot
While Power Query focuses on data transformation and cleansing, PowerPivot enables users to create robust data models and perform advanced analysis within Excel.
Creating Data Models
With PowerPivot, users can create sophisticated data models that go beyond Excel's traditional row-and-column structure. Data models allow users to establish relationships between tables, define hierarchies, and enrich the data with calculated columns and measures. These models provide a foundation for in-depth analysis and enable users to slice, dice and visualise data in a more flexible and interactive manner.
Analysing Data with PivotTables and PivotCharts
PowerPivot seamlessly integrates with Excel's native PivotTable and PivotChart functionalities. Users can leverage the power of data models created in PowerPivot to create dynamic reports, perform ad-hoc analysis, and gain insights from large datasets. PivotTables allow users to summarize data, apply filters and drill down into specific details, while PivotCharts provide visually appealing representations of data for easier comprehension.
Building Relationships between Tables
PowerPivot simplifies the process of establishing relationships between tables in Excel. Users can define relationships based on common fields, enabling seamless data exploration and analysis across multiple tables. This capability is particularly valuable when working with complex datasets that require integrating data from various sources.
Power Query and PowerPivot in Action
Real-life Examples of Data Analysis
The combined power of Power Query and PowerPivot enables users to tackle real-life data analysis challenges efficiently. Whether it's analyzing sales data, tracking inventory, or conducting financial analysis, these tools provide the flexibility and capabilities to handle complex datasets and derive valuable insights. Users can perform calculations, create custom metrics and visualise data in ways that were not possible with traditional Excel functionalities alone.
Enhancing Data Visualisation
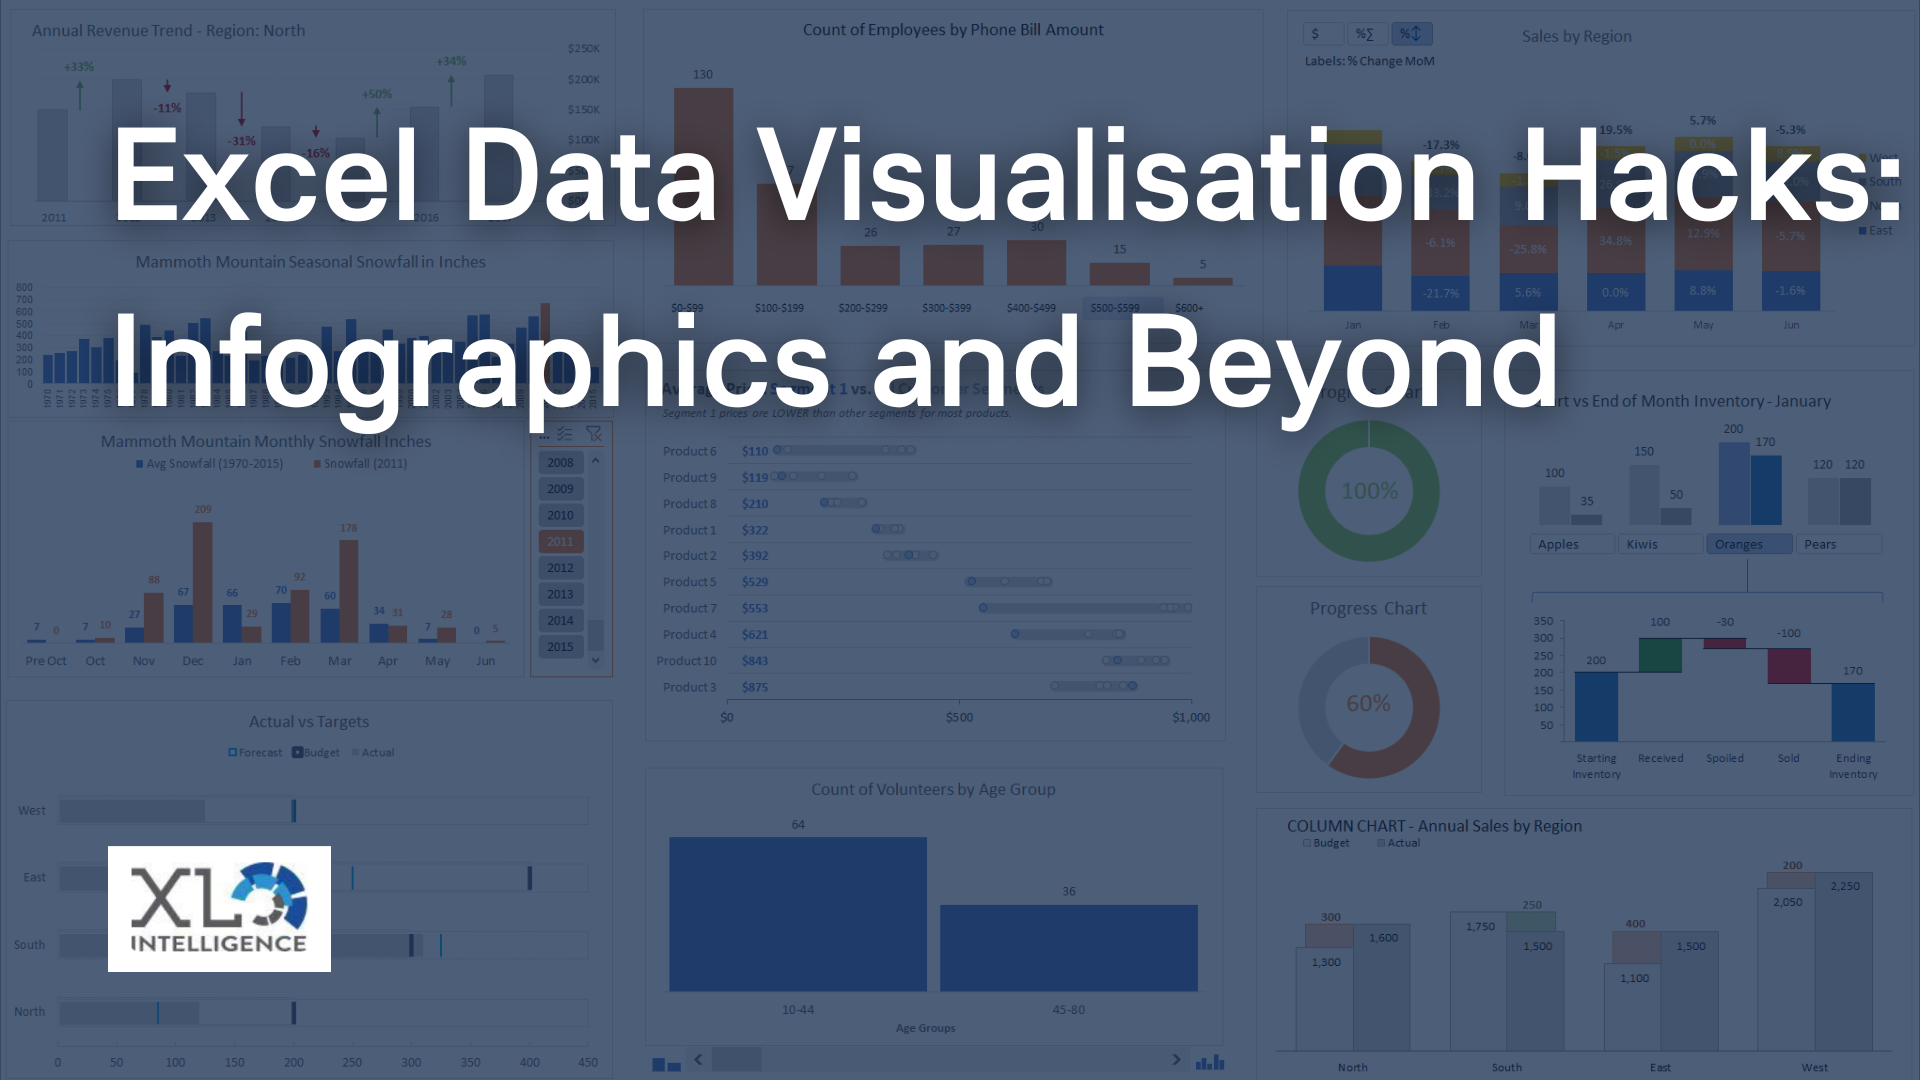
Data visualisation plays a crucial role in communicating insights effectively. With PowerPivot, users can create interactive dashboards and reports that provide a comprehensive view of the data. By leveraging PivotCharts and slicers, users can dynamically explore data, apply filters and gain deeper insights. The ability to combine multiple data sources and create relationships between tables allows for more comprehensive and impactful visualisations.
Automating Data Refresh
Power Query and PowerPivot enable users to automate data refresh, ensuring that analysis and reports always reflect the latest data. By setting up data connections and refreshing options, users can establish scheduled refreshes or trigger refreshes with a single click. This automation saves time and ensures data integrity for ongoing analysis and reporting.
Power Query and PowerPivot Integration with Power BI
Power Query and PowerPivot are not limited to Excel; they are integral components of Microsoft's broader data analysis and visualisation ecosystem, including Power BI. Power BI offers advanced capabilities for data exploration, interactive visualizations, and sharing insights. Users can leverage Power Query and PowerPivot skills to seamlessly transition between Excel and Power BI, empowering them to build comprehensive data models, create compelling reports, and share insights across organisations.
The Growing Importance of Power Query
Power Query in Other Microsoft Tools and Services
The utility of Power Query extends beyond Excel and Power BI. Microsoft has integrated Power Query into various tools and services, including Power Automate, Azure Data Factory, and more. This integration allows users to harness the power of Power Query across different platforms, enabling data extraction, transformation, and loading (ETL) processes in a unified and consistent manner.
Learning Resources and Communities
To master Power Query and PowerPivot, users can access a wealth of learning resources and communities. Microsoft provides official documentation, tutorials, and training courses to help users get started and explore advanced features. Additionally, online communities and forums offer a platform for users to connect, share insights, and seek guidance from experts in the field.
Excel PowerPivot and Power Query empower users to take their data analysis and insights to the next level. These powerful tools provide the ability to import, transform, and combine data from multiple sources, create sophisticated data models, and perform advanced analysis within Excel. By harnessing the capabilities of Power Query and PowerPivot, users can save time, enhance data visualisation, automate data refresh and gain valuable insights for informed decision-making.
Click HERE to learn more about using Excel to display data in ways you didn’t think possible. Learning Power Pivot skills to use in Excel for your business’ data, you can thoroughly understand how one set of data affects another.
Or get in touch HERE and find out how we can help with your training and consultancy needs.


