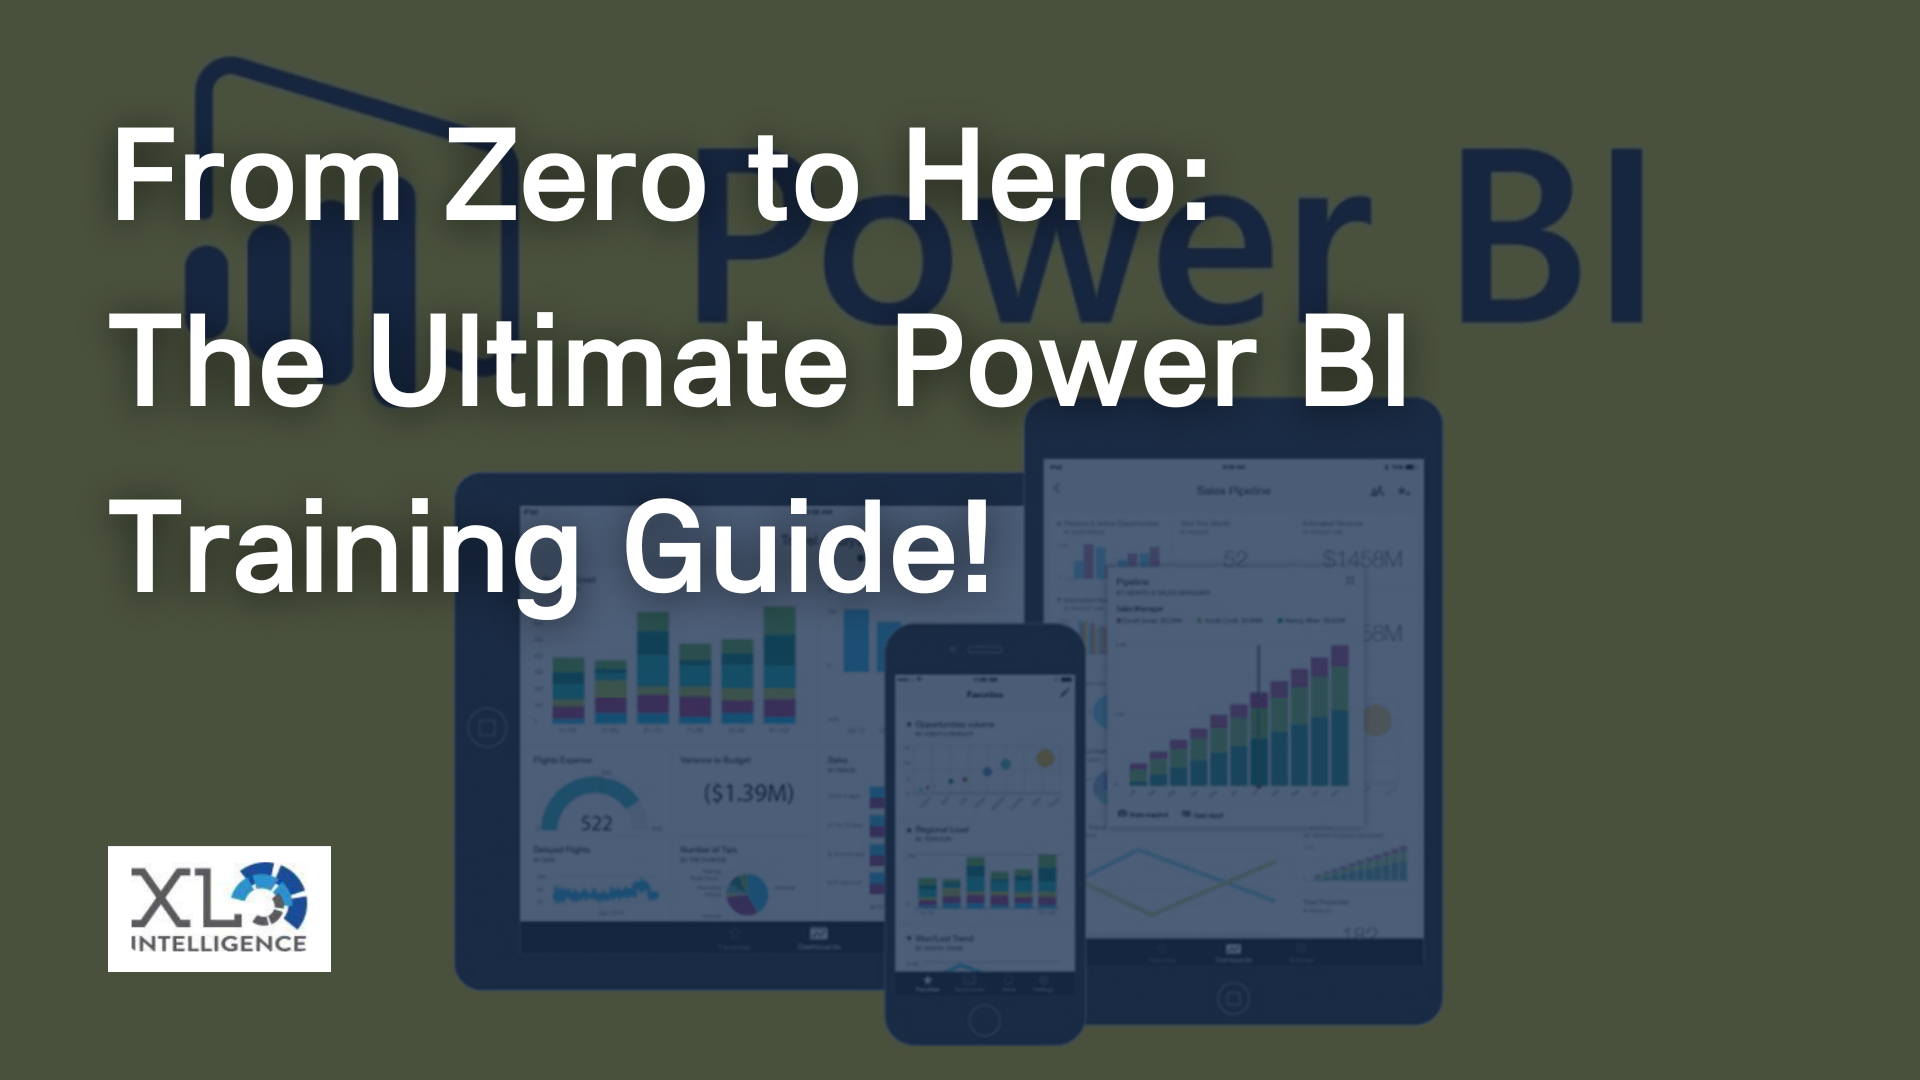
The Ultimate Power BI tutorial for beginners

Hey there, future Power BI superstar! Get ready to embark on an exciting journey to master the art of data analysis and visualisation with Power BI. As a Power BI expert at XL Intelligence, I'm thrilled to be your guide on this fun and informative adventure. Whether you're a beginner or looking to level up your Power BI skills, this step-by-step guide will equip you with the essential knowledge and techniques to become a data rockstar. So, buckle up and let's dive into the world of Power BI!
Understanding the Basics of Power BI:
Getting Started with Power BI - Your Superpower Unveiled!
Welcome to the incredible world of Power BI! Before we unleash its power, let's start with the basics. We'll take a closer look at the components of Power BI, including Power BI Desktop, Power BI Service, and Power BI Mobile. Think of Power BI Desktop as your superhero tool for creating amazing visualisations, Power BI Service as your sidekick for sharing and collaborating, and Power BI Mobile as your trusty sidekick that allows you to access your data on the go!
Connecting to Data Sources:
Unlocking Data Insights with Power BI - The Treasure Hunt Begins!
Now that you've got the hang of the Power BI universe, it's time to go on a data treasure hunt! Learn how to connect Power BI to various data sources, like Excel, SQL databases, or even cloud-based services. We'll equip you with the skills to navigate through data obstacles and transform raw data into shiny insights.
Personal Anecdote:
Early in my career I was tasked with exploring sales data from a spreadsheet. With Power BI, I effortlessly connected to the spreadsheet and transformed the data into an interactive dashboard. It was like finding a hidden treasure trove of valuable insights, and I couldn't wait to share it with my team!
Creating Visualisations and Reports:
Crafting Compelling Data Visualisations - Picasso, Meet Power BI!
Let's unleash your inner Picasso and turn data into visual masterpieces! We'll dive into the art of creating compelling visualisations using Power BI Desktop. Explore a plethora of visual options, from colourful charts to informative tables and eye-catching maps. Learn how to bring your data to life with formatting options, themes, and custom visuals.
Personal Anecdote:
Once, I had a project where I needed to showcase the growth of online sales for a client. Instead of presenting a boring spreadsheet, I created a dynamic line chart in Power BI that showed the upward trend over time. My client was amazed by how engaging and easy-to-understand the visualisation was, and it led to a fruitful partnership!
Building Interactive Dashboards:
Designing Interactive Dashboards - Your Data Control Centre!
Get ready to become the master of your data control centre with interactive dashboards! Learn how to design captivating dashboards that provide a 360-degree view of your data. Empower users to explore, filter, and drill down into the details that matter. We'll show you how to create slicers, implement drill-throughs, and use bookmarks to enhance the user experience.
Implementing Data Transformations and Modelling:
Shaping Data for Analysis and Modelling - The Data Wizard Unleashed!
Every data superhero needs to be a data wizard too! We'll delve into the world of data transformations and modelling using Power BI's Power Query Editor. Discover how to clean and reshape data, establish relationships between different data tables, and create calculated columns and measures using the powerful DAX language.
Sharing and Collaborating with Power BI:
Collaborative Data Analysis with Power BI - Joining Forces for Insights!
Superheroes never work alone! Learn how to share your reports and dashboards with colleagues, turning data analysis into a collaborative experience. We'll guide you through publishing reports, managing access permissions, and collaborating in real-time using Power BI Service. Plus, we'll explore embedding reports in other applications for wider consumption.
Personal Anecdote:
Working on a team project, we used Power BI's collaboration features to work seamlessly together. We were able to share insights, annotate reports, and have real-time discussions, making the entire process both efficient and enjoyable. It was like assembling a superhero team to tackle data challenges!
Advanced Features and Tips:
Taking Your Power BI Skills to the Next Level - Unleash Your Inner Superhero!
Congratulations, data superhero! You've mastered the essentials, but there's always room to level up your skills. In this section, we'll explore advanced features and tips to make you a Power BI legend. From advanced data modelling techniques to custom visuals and integrating R or Python, you'll have all the tools you need to tackle even the most complex data challenges.
Personal Anecdote:
Once, I had a project that required advanced calculations beyond what the default Power BI functions could provide. But fear not! With DAX, I created complex measures that uncovered hidden patterns and trends in the data. It was like unlocking a secret code that gave me superpowers to make data-driven decisions.
Conclusion:
Congratulations, future Power BI superstar! You've completed the fun and informative journey to master Power BI. With your newfound skills, you're now equipped to turn data into insights and make data-driven decisions like a true superhero.
Remember, practice makes perfect! Keep experimenting, exploring new features, and challenging yourself with data puzzles. And if you ever need expert guidance or assistance on your Power BI adventures,
contact us at XL Intelligence to book a FREE Power BI consultation. Our team of experienced professionals is ready to help you unleash the power of your data with Power BI.
Now go forth, embrace your Power BI superpowers, and create a data-driven world that amazes everyone around you!
Get in Touch
We will get back to you as soon as possible.
Please try again later.
We specialise in Advanced Excel training, Dashboard development, Data Analysis, Power BI and VBA. We also provide training with, both standard and customised courses to suit your organisation’s needs.
Quick Links
Address
2, 26 Linden Gardens London W2 4ES
Phone
07737 707 548
by SEO Local Services | All Rights Reserved | XLIntelligence


