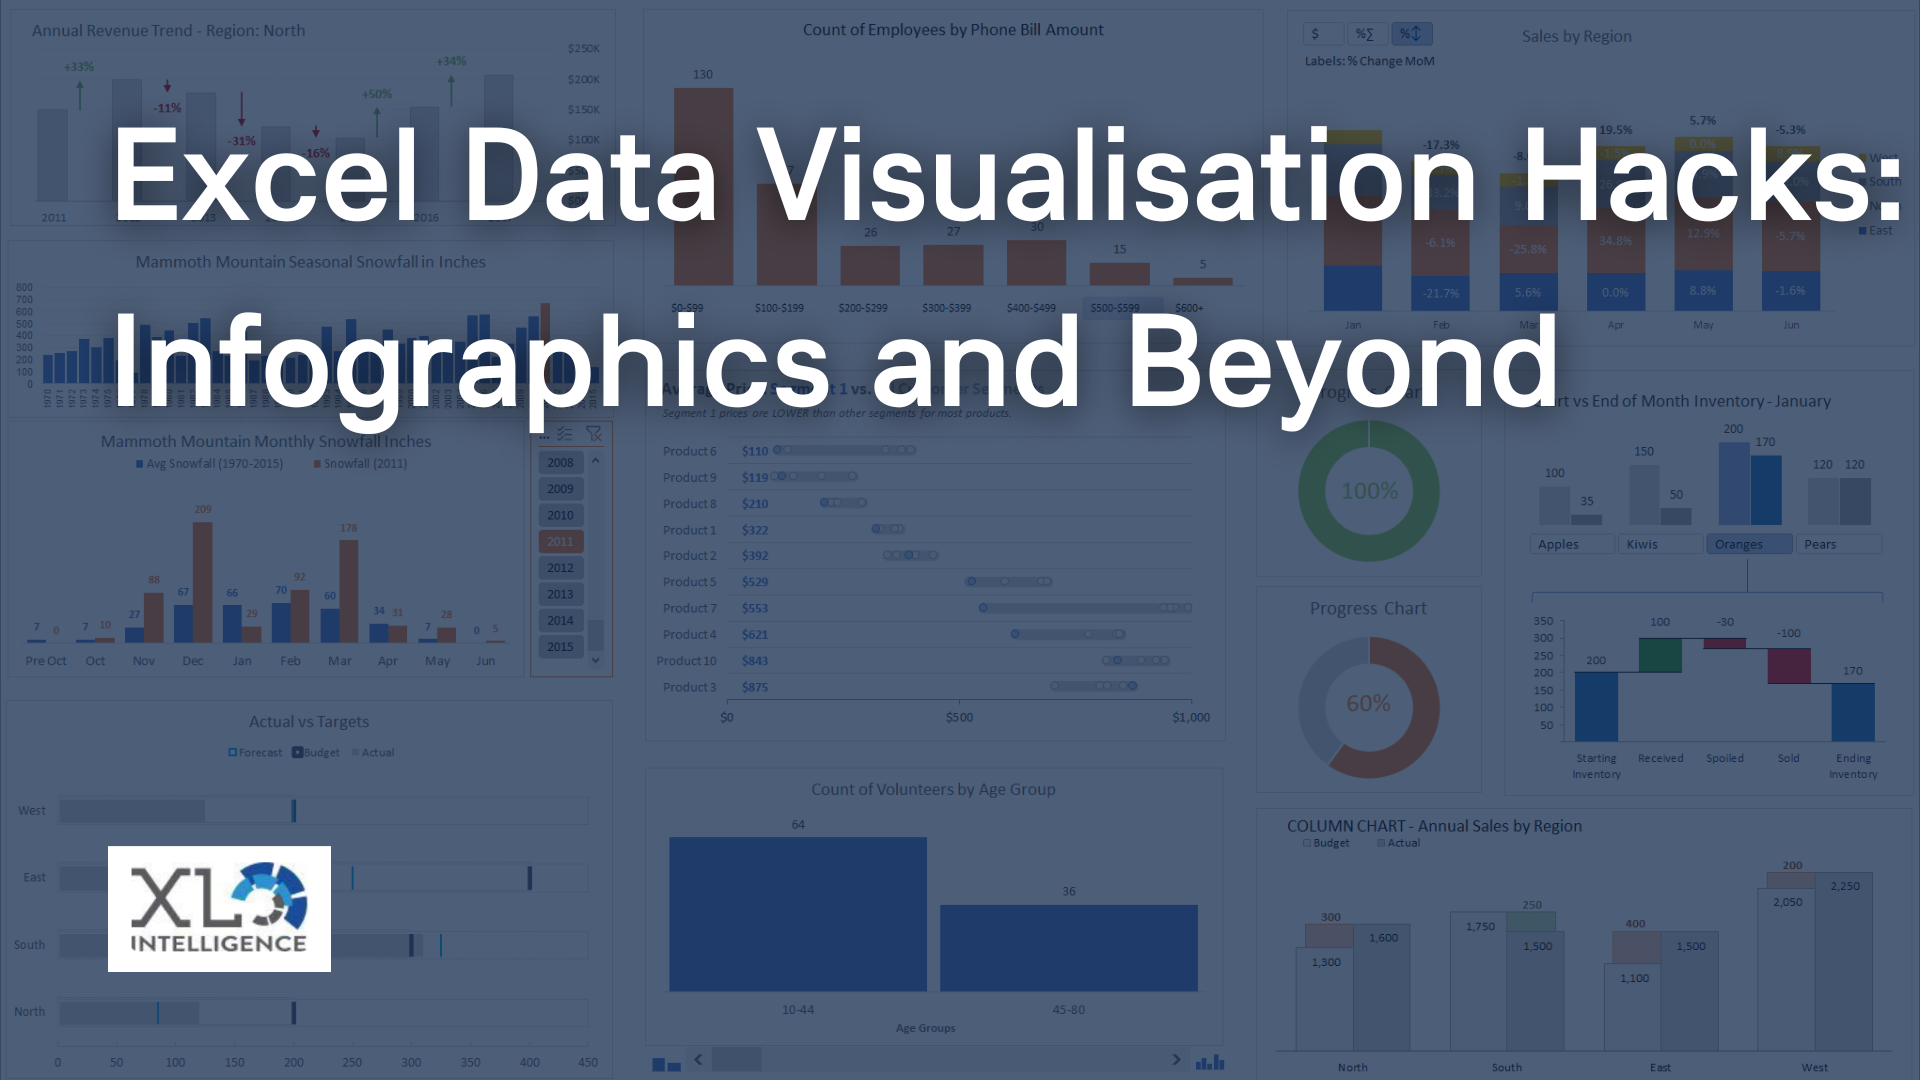
Power BI stunning dashboard design

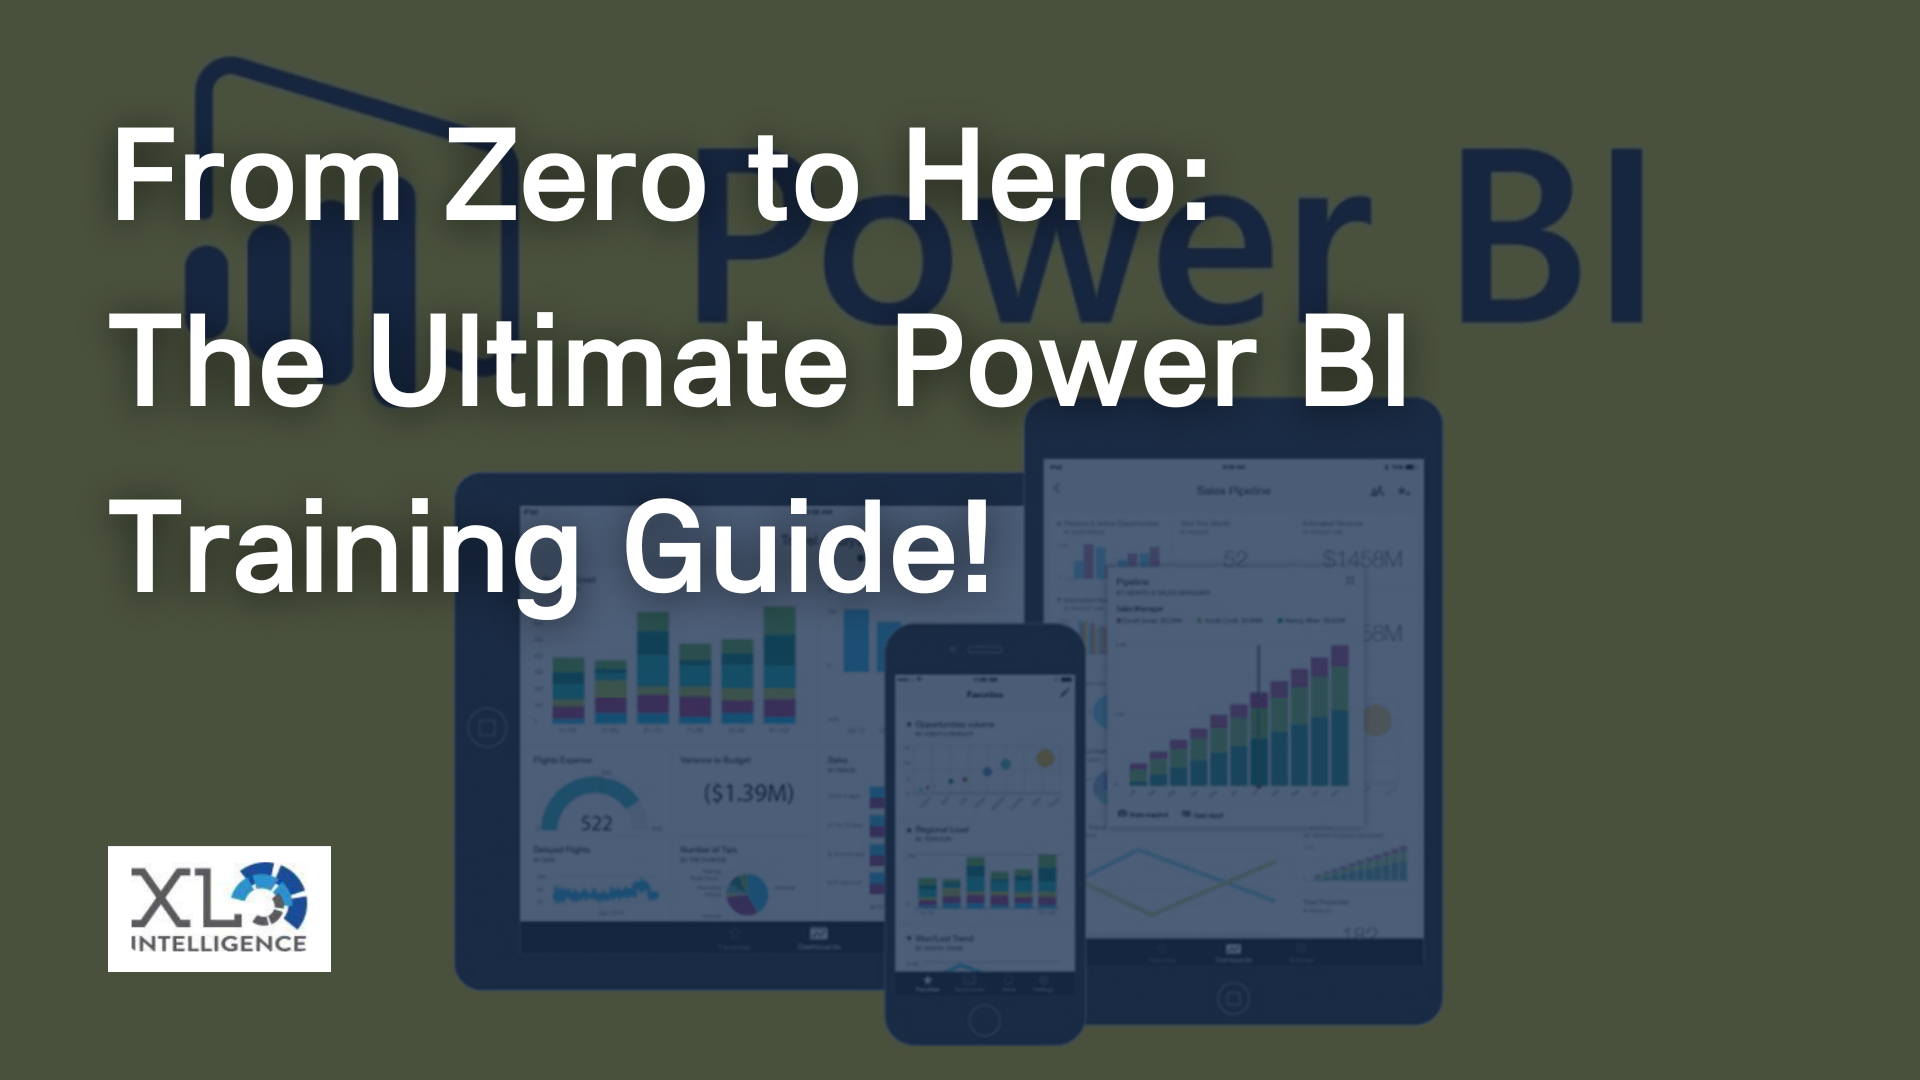
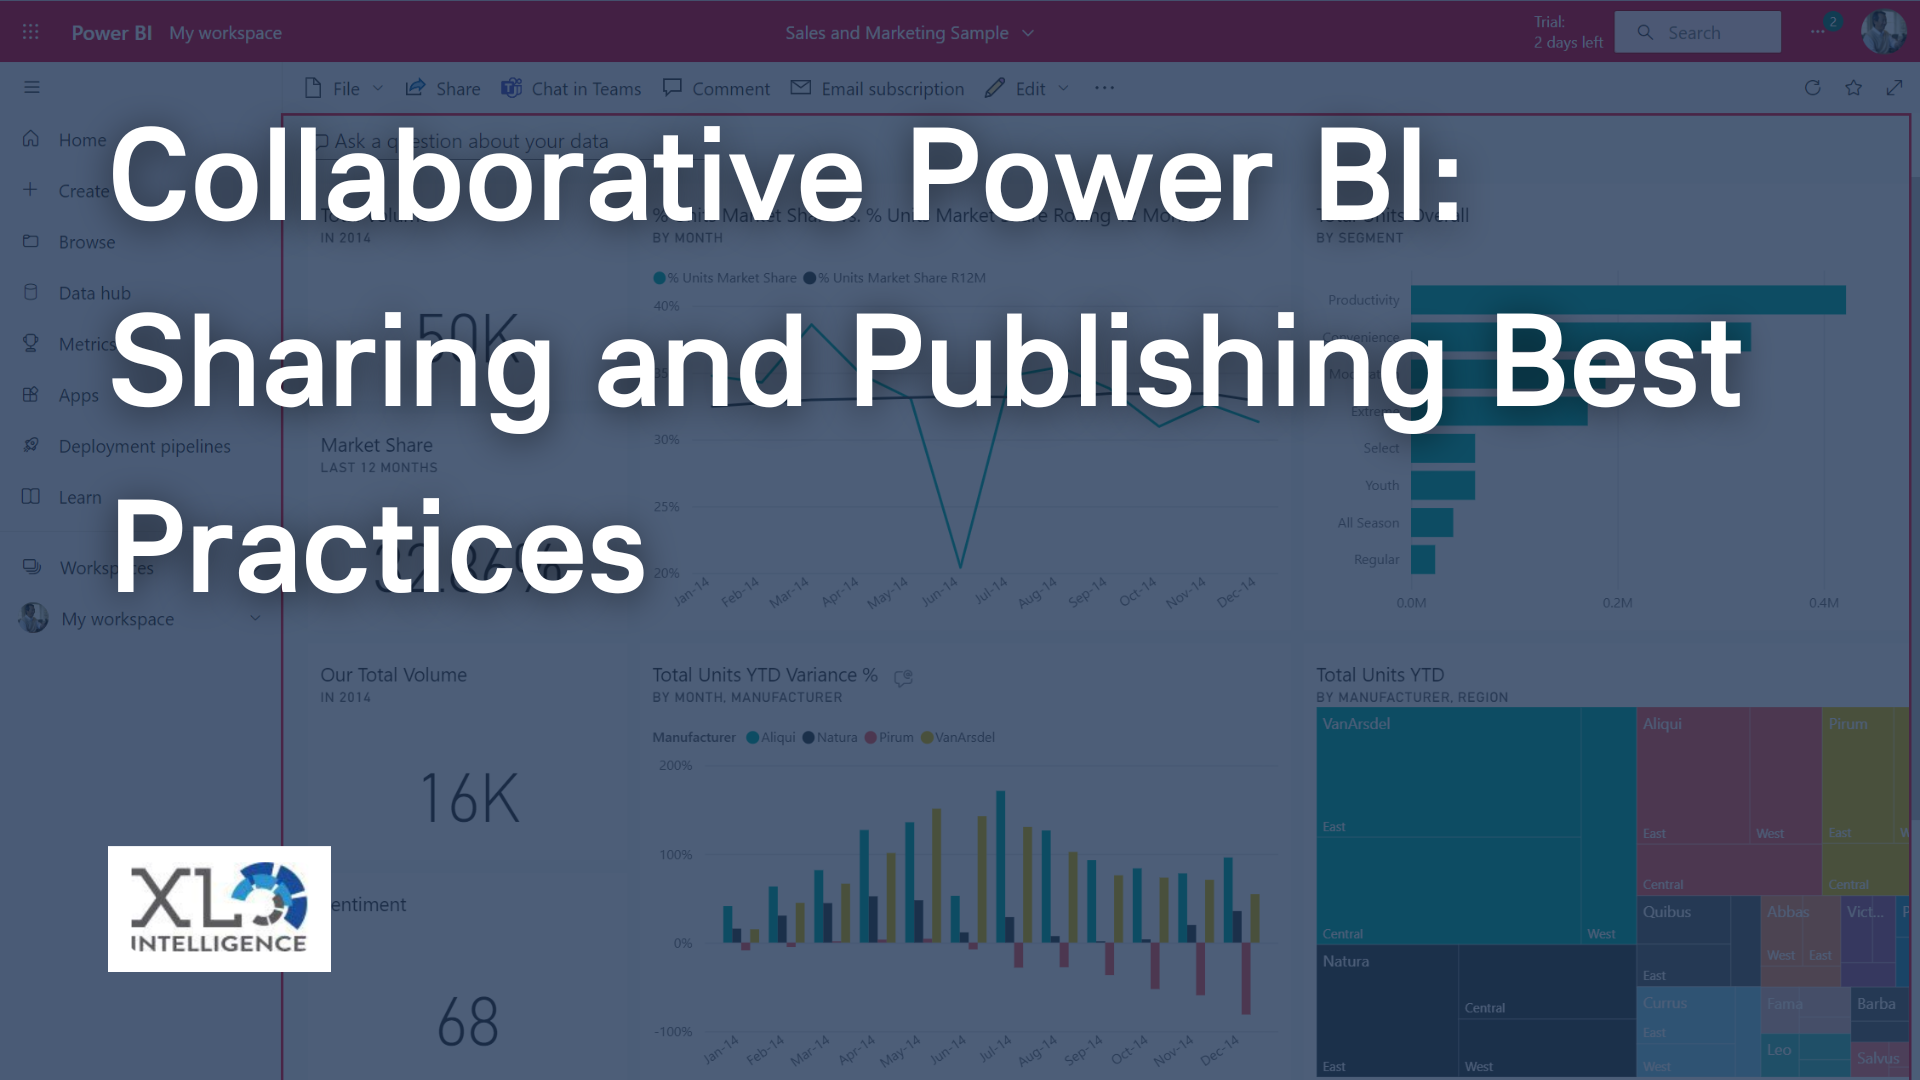
In today's data-driven landscape, making sense of vast amounts of information quickly is paramount. This is where Power BI, a business analytics service by Microsoft, steps in, offering a powerful platform to transform raw data into meaningful insights. At XL Intelligence, we understand that data visualisation is more than just numbers and charts—it's an art that combines analytical precision with design finesse. In this article, we'll delve into the realm of Power BI stunning dashboard design and how XL Intelligence's expertise can help you create captivating visuals that tell compelling data stories.
The Art of Power BI Stunning Dashboard Design
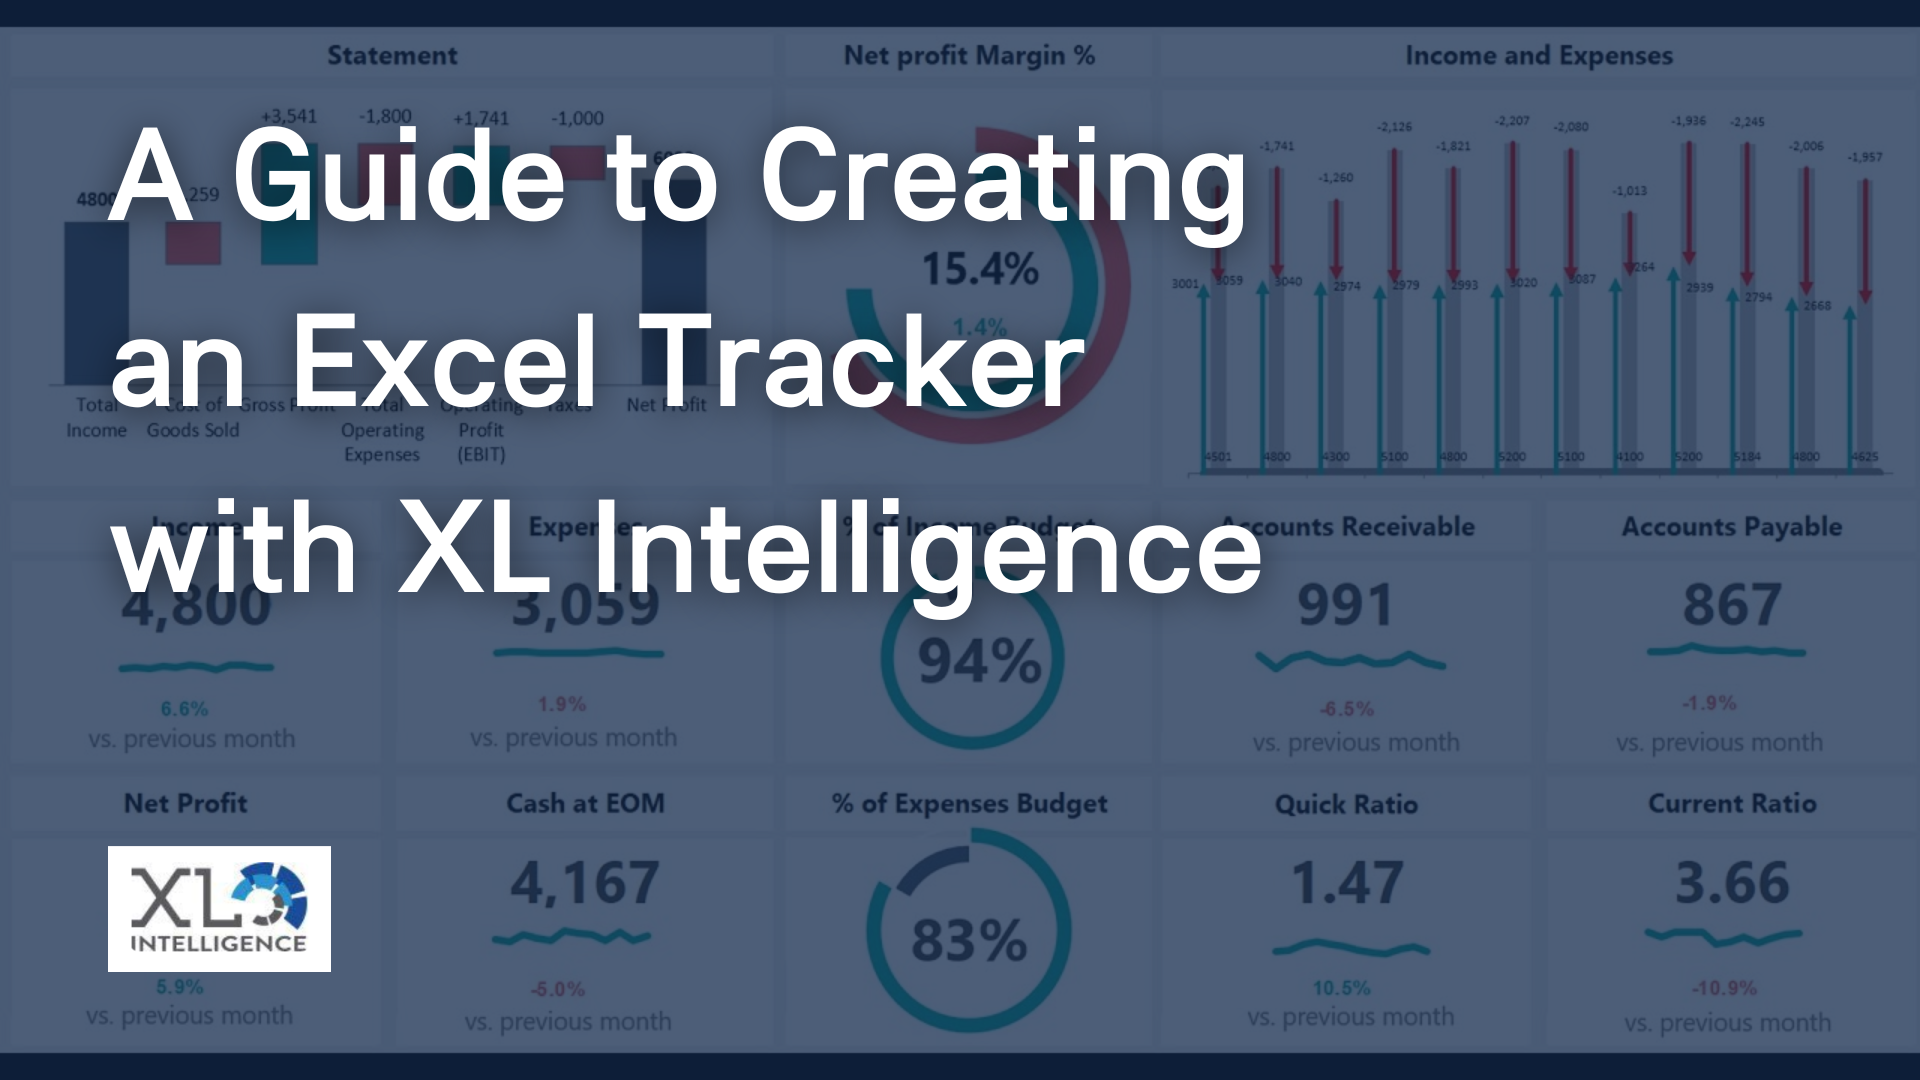
At the heart of Power BI lies the intersection of data and design. The ability to convert complex datasets into visually appealing dashboards empowers decision-makers to extract insights at a glance. We believe that design plays a crucial role in engaging users and conveying information effectively. With Power BI's versatile toolkit, we're able to craft dashboards that not only present data but also captivate and resonate with the audience.
Understanding the Power BI Dashboard Interface
Navigating the Power BI dashboard interface is akin to wielding a creative canvas. From data connections to visualisation options, every tool is strategically placed to enhance the user experience. Through years of experience, our team at XL Intelligence has mastered this interface, allowing us to seamlessly blend data sources and design elements for stunning outcomes.
Crafting Compelling Visualisations
Visualisations are the cornerstone of any impactful dashboard. They transform raw data into visual narratives that convey insights with clarity. Power BI offers an array of visualisations, from bar charts and scatter plots to geospatial maps and custom visuals. Our approach at XL Intelligence involves selecting the most suitable visualisations for your data story and fine-tuning them for maximum impact.
Leveraging Advanced Formatting and Customization
Formatting and customization are where dashboards truly come to life. Through careful selection of colour palettes, fonts, and backgrounds, we create a harmonious visual experience that resonates with your brand identity. With Power BI's custom themes and formatting options, we infuse a unique personality into each dashboard. An example that comes to mind is when a client's brand colours were seamlessly integrated into the dashboard's design, creating a sense of familiarity and reinforcing the client's visual identity.
Storytelling with Data: Weaving Narratives in Dashboards
Data storytelling is the art of transforming data points into a coherent narrative. A well-structured data story guides the user's journey through the dashboard, ensuring that insights are discovered in a logical sequence. At XL Intelligence, we believe that a compelling data story makes the difference between a dashboard that's glanced at and one that's explored. Our team carefully arranges visualisations, annotations, and supporting text to create a narrative flow that guides users towards meaningful conclusions.
Power BI's Interactive Features for User Engagement
Interactivity is the secret sauce that transforms dashboards from static presentations to immersive experiences. Power BI offers features like drill-through, slicers, and bookmarks, which allow users to dive deeper into the data, filter relevant information, and save their exploration paths. This interactivity not only engages users but also empowers them to explore the data at their own pace, gaining insights tailored to their needs.
Data-Driven Decisions: Showcasing ROI through XL Intelligence's Dashboards
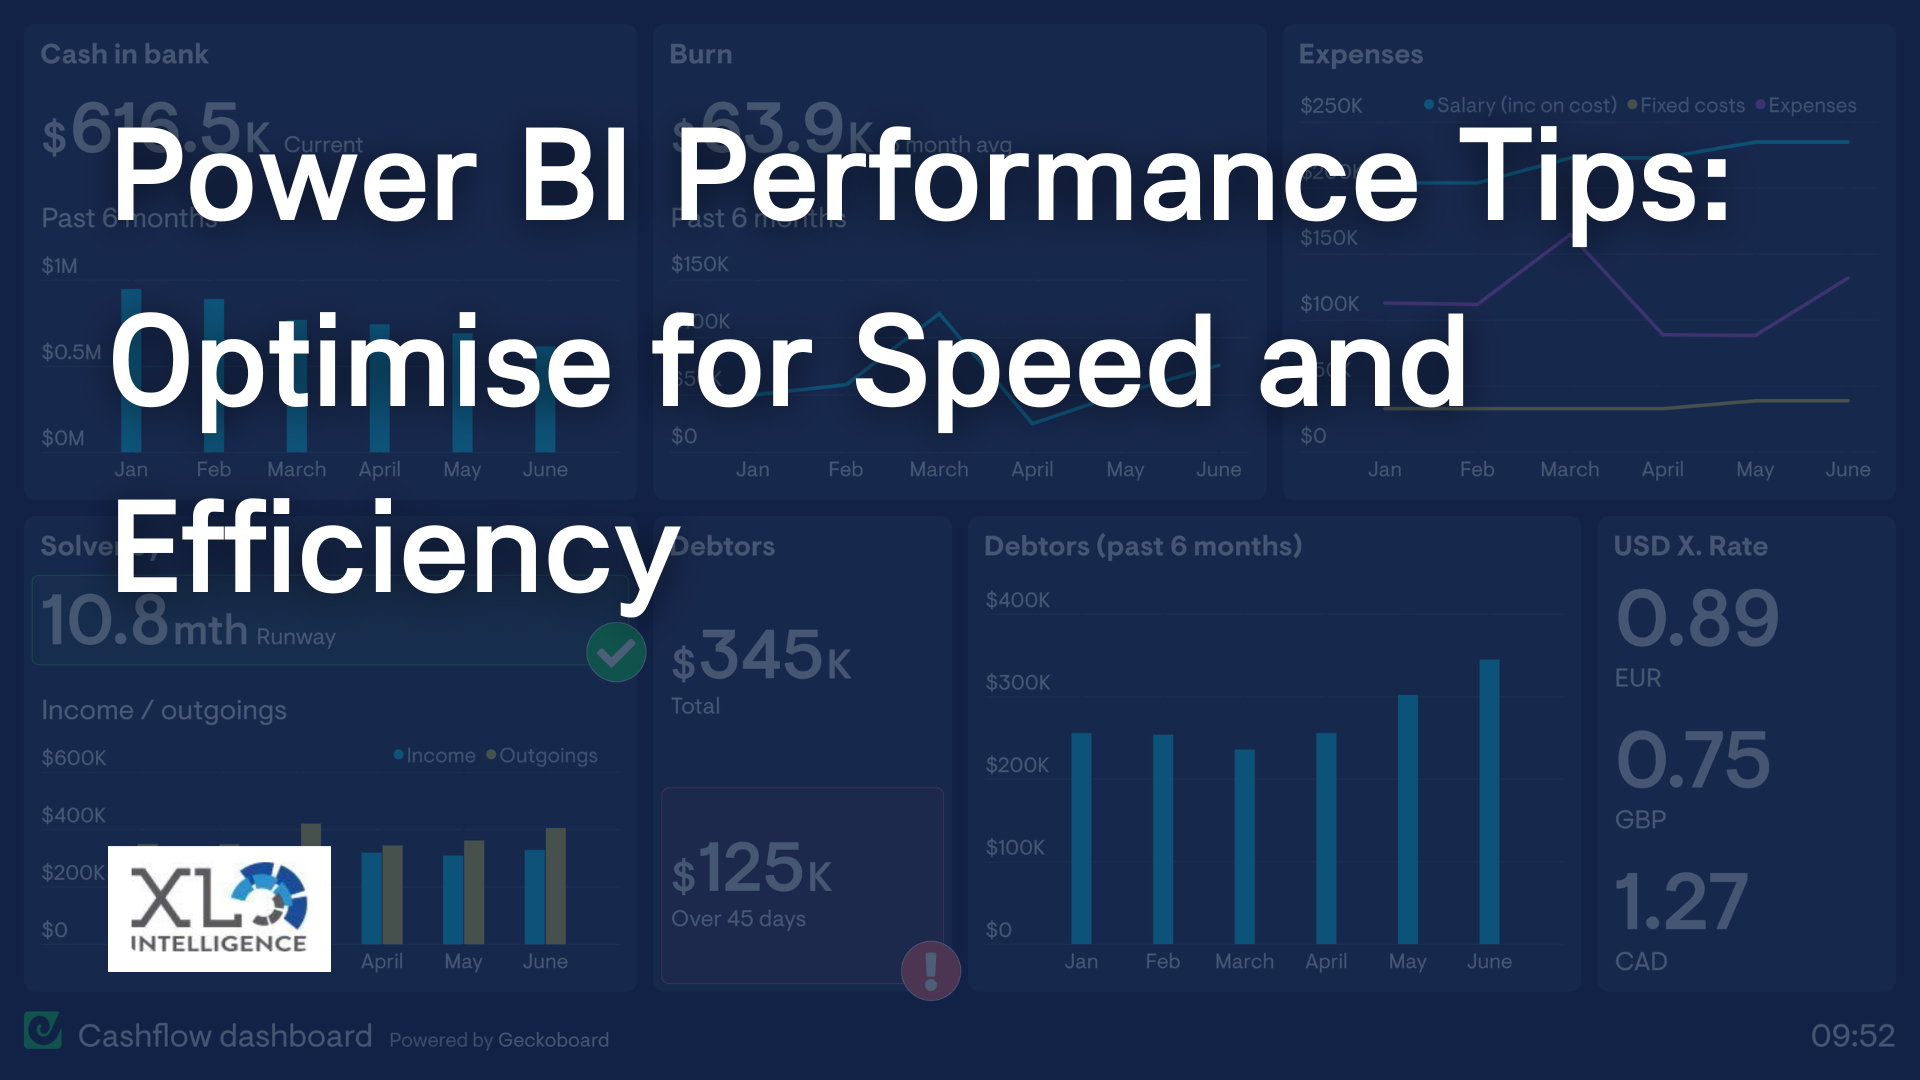
Ultimately, the value of a stunning dashboard lies in its ability to drive data-driven decisions. At XL Intelligence, we've witnessed firsthand the impact of our designs on our clients' businesses. From optimising supply chains to identifying growth opportunities, our dashboards have catalysed actions that yield tangible results. For instance, a client in the retail sector saw a substantial increase in operational efficiency by using our interactive dashboard to monitor inventory levels and demand trends in real time.
Conclusion
In the world of data visualisation, Power BI stands as a dynamic tool that empowers businesses to translate raw data into actionable insights. The synergy of data analytics and design can yield visually captivating dashboards that tell compelling stories. At XL Intelligence, we're passionate about leveraging the power of Power BI to create stunning visuals that resonate with audiences and drive informed decision-making.
Ready to transform your data into stunning Power BI dashboards that inspire action? Contact XL Intelligence today to discover how our expertise can elevate your data visualisation game. Visit our Contact Page to get in touch with our team of experts. Your data has stories to tell—let us help you tell them beautifully.
Get in Touch
We will get back to you as soon as possible.
Please try again later.
We specialise in Advanced Excel training, Dashboard development, Data Analysis, Power BI and VBA. We also provide training with, both standard and customised courses to suit your organisation’s needs.
Quick Links
Address
2, 26 Linden Gardens London W2 4ES
Phone
07737 707 548
by SEO Local Services | All Rights Reserved | XLIntelligence


