Excel financial analysis techniques for beginners

Welcome to the world of financial analysis in Excel! As an Excel expert specialising in Microsoft Excel, I am excited to guide you through the process of using this powerful tool to uncover valuable insights for strategic decision making. Financial analysis plays a crucial role in evaluating the financial health of a business and making informed decisions, and Excel provides the perfect platform to crunch numbers, organise data, and visualise trends. So, let's dive in and discover how Excel's financial analysis techniques can empower you in your journey!
Getting Started with Excel
Before we delve into financial analysis, let's get familiar with the basics of Excel. The interface may seem overwhelming at first, but fear not! Excel's user-friendly design makes it easy to navigate and perform tasks efficiently. From the Ribbon at the top, you can access various features, including formatting options, functions, and data analysis tools. Worksheets serve as your digital canvas, and workbooks help you organise related worksheets.
Essential Excel Functions for Financial Analysis
Excel offers a plethora of functions that are essential for financial analysis. To start, let's explore some foundational functions. The SUM function allows you to quickly add up values, while AVERAGE calculates the mean of a range. MIN and MAX help identify the lowest and highest values, respectively. Another valuable function is COUNT, which tallies the number of cells containing numerical data. For more specific analysis, the COUNTIF function enables you to count cells based on specific criteria. Additionally, the IF function allows you to perform calculations based on certain conditions, making it a powerful tool for financial analysis.
Organising Financial Data in Excel
Effective financial analysis relies on well-organised data. Excel provides features to help you structure and manage your financial data efficiently. Creating tables allows for easy sorting, filtering, and formatting of data. By utilising filters, you can narrow down your data based on specific criteria, making it simpler to extract insights. Sorting data in ascending or descending order allows you to identify patterns and trends more easily.
Using Excel Formulas for Financial Analysis
Now that your data is organised, let's leverage Excel's formulas to perform financial analysis. Financial ratios are a key component of analysing a company's financial health. For example, you can calculate profitability ratios such as the gross profit margin or return on investment (ROI) using simple formulas. By dividing the gross profit by the revenue or dividing the net profit by the total investment, you can gain insights into the company's profitability. Additionally, liquidity ratios, such as the current ratio or quick ratio, can be calculated to assess the company's ability to meet short-term obligations. Solvency ratios, including the debt-to-equity ratio or interest coverage ratio, provide an understanding of the company's long-term financial stability. Excel's formula capabilities make these calculations quick and accurate, saving you time and effort.
Visualising Financial Data with Charts and Graphs
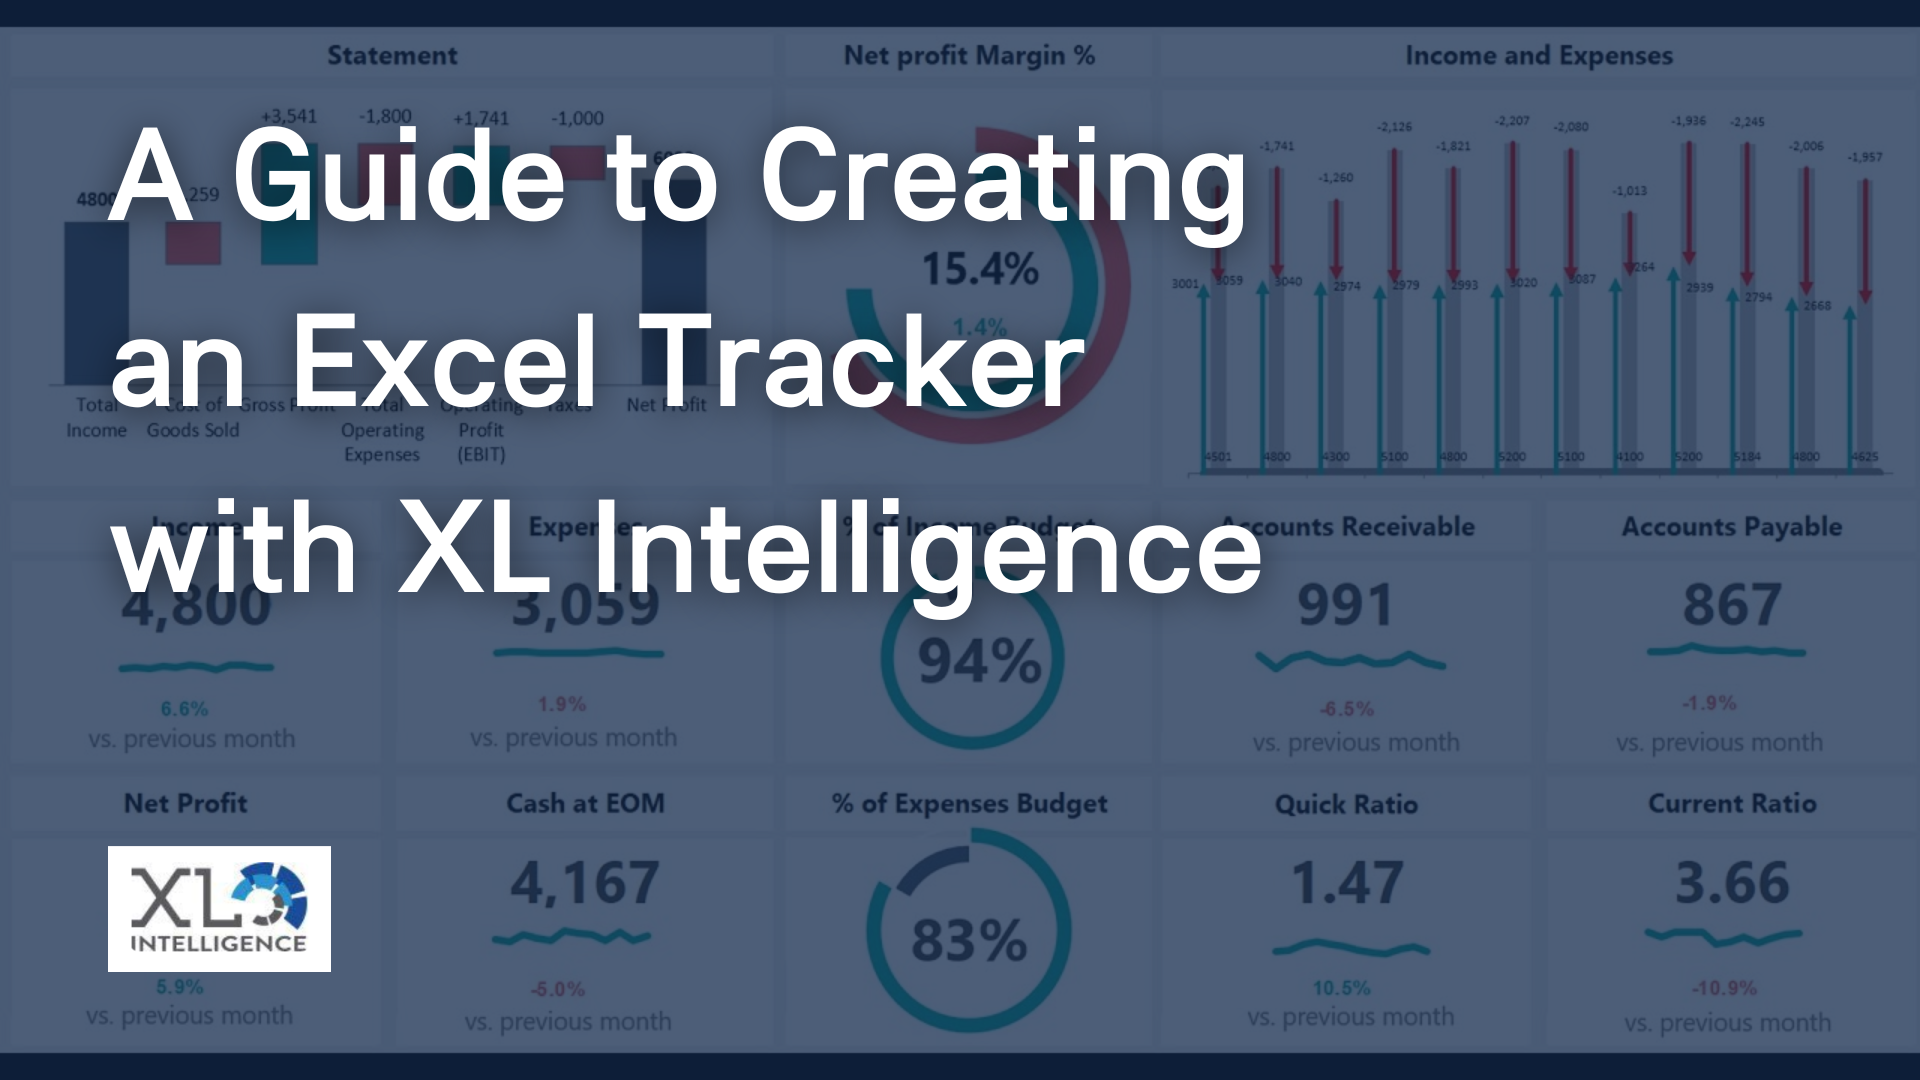
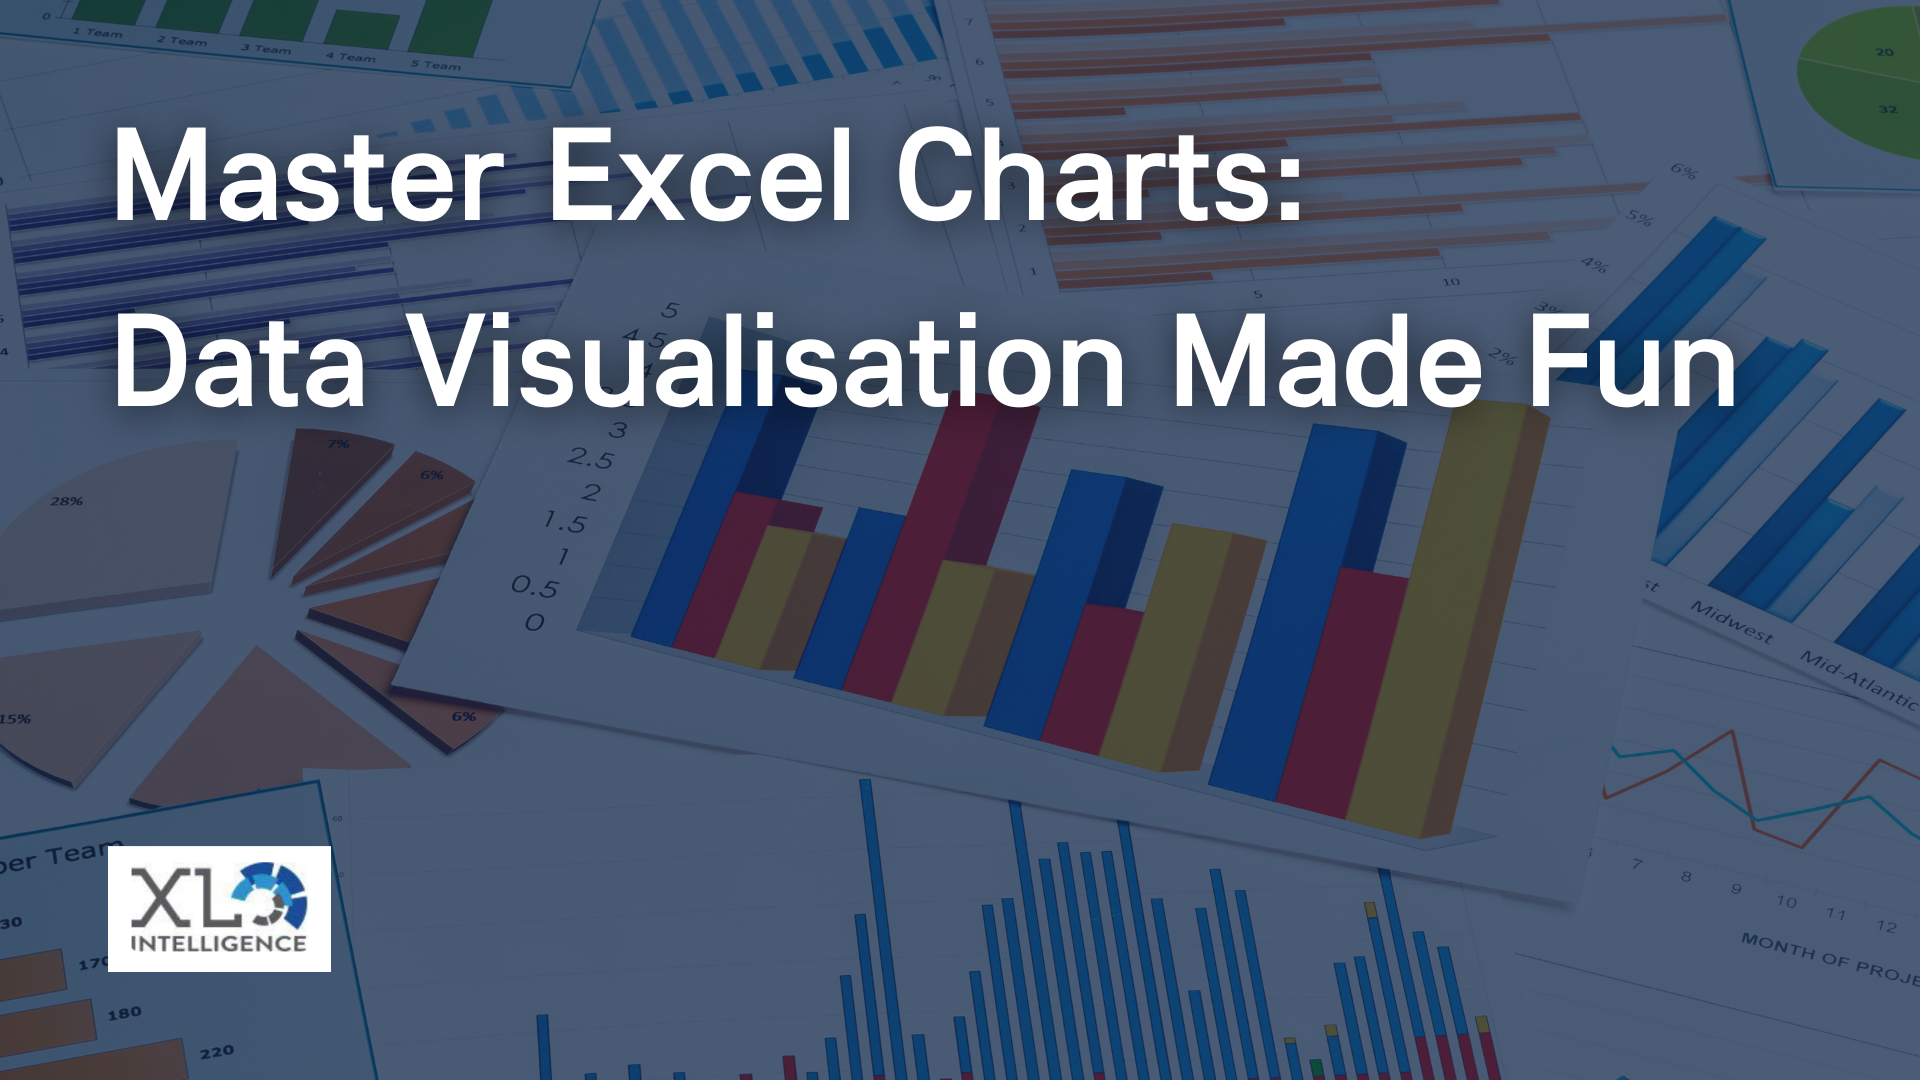
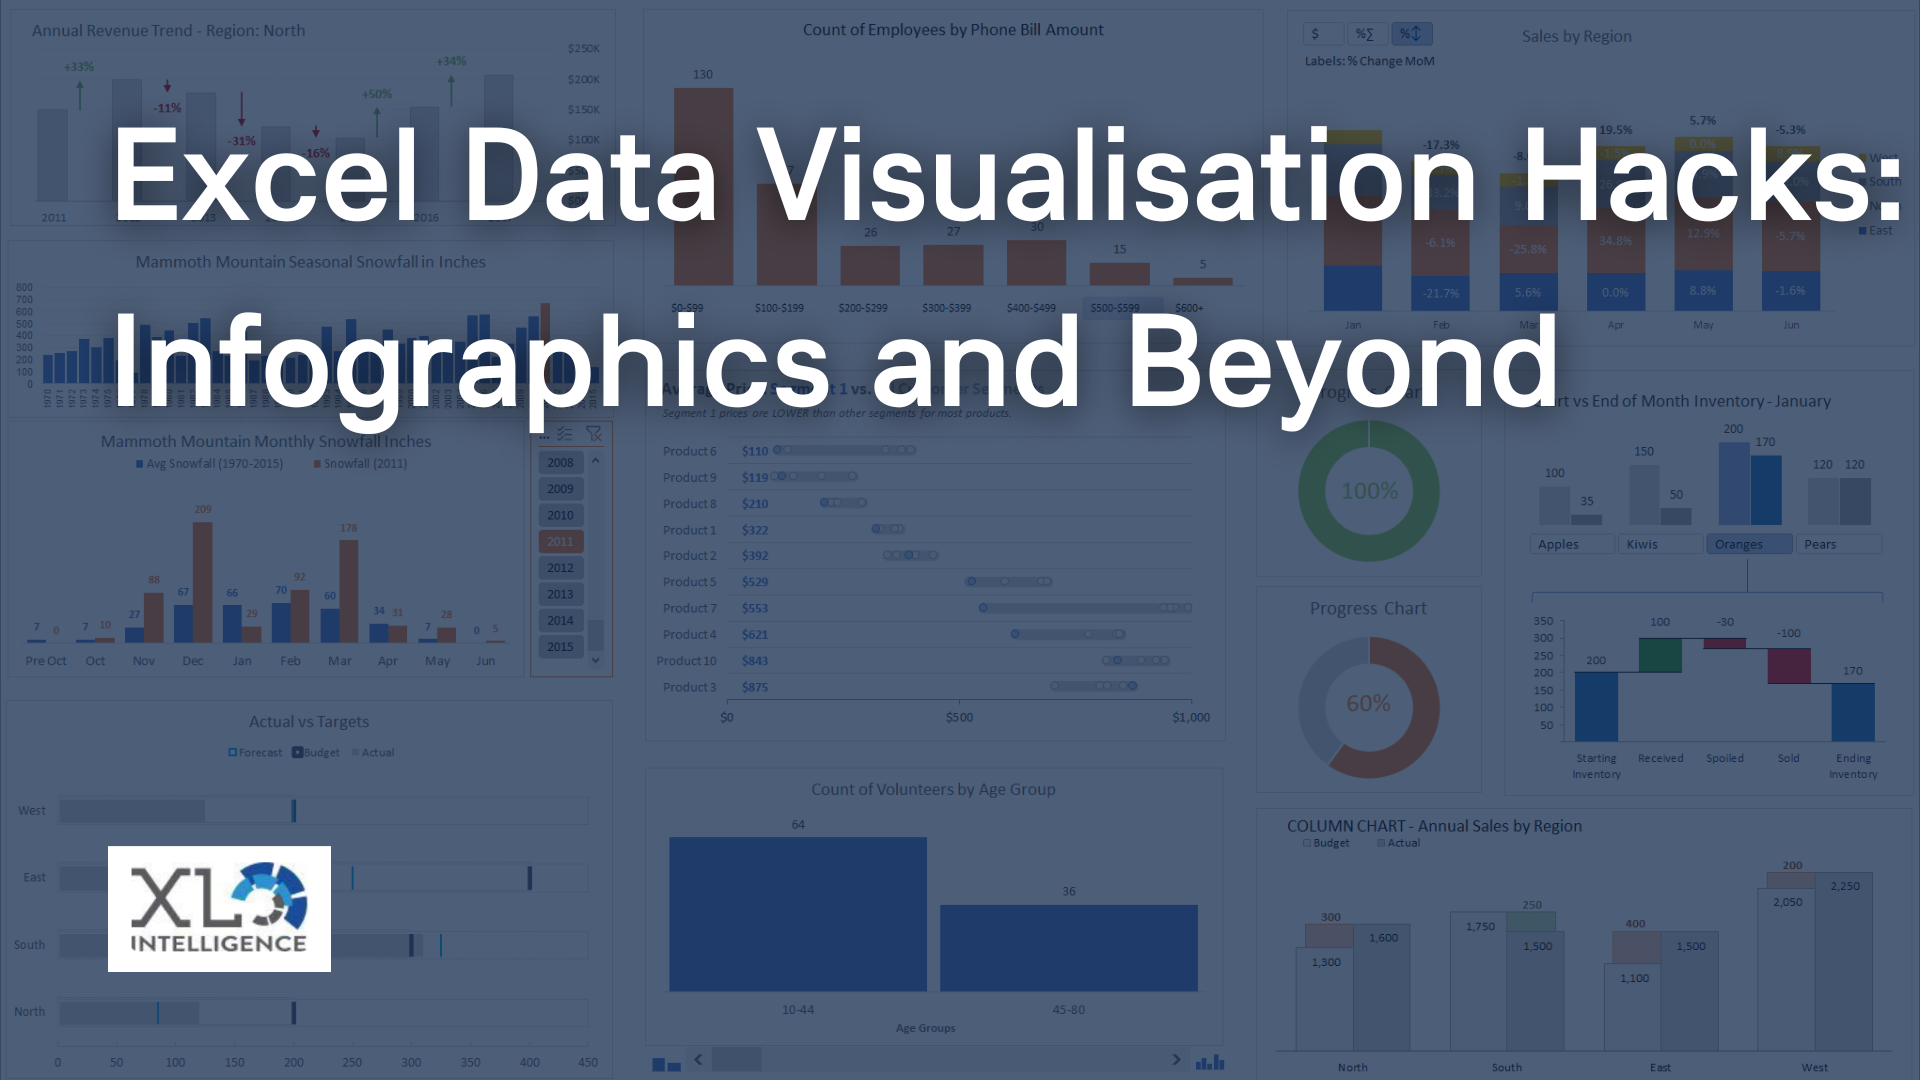
Numbers alone can be overwhelming, but Excel's charting capabilities allow you to transform data into visual representations. Visualising financial data helps identify trends, patterns, and outliers more effectively. Bar charts, line graphs, and pie charts are just a few examples of the wide range of chart types available. For instance, you can use a bar chart to compare the revenue of different product categories over time or a pie chart to represent the distribution of expenses across departments. By customising the formatting and labelling of your charts, you can highlight key insights and make your analysis more compelling.
Leveraging Excel's Data Analysis Tools
Excel offers advanced data analysis tools that can take your financial analysis to the next level. PivotTables are powerful tools for summarising and analysing large datasets. They allow you to slice and dice data, explore trends, and generate meaningful reports with a few clicks. Furthermore, Excel's What-If Analysis enables you to perform scenario analysis by altering variables and observing the impact on outcomes. This feature proves invaluable when evaluating potential financial decisions and assessing their consequences.
Advanced Techniques for Financial Modeling
Financial modelling involves creating mathematical representations of financial scenarios to support decision making. Excel offers advanced features to facilitate financial modelling. Goal seek allows you to determine the input required to achieve a specific outcome. For instance, you can use goal seek to determine the sales target needed to reach a desired profit margin. Solver, another powerful tool, helps optimise complex financial models by finding the optimal solution based on specific constraints. These advanced techniques enable you to perform sophisticated analyses and make informed decisions.
Tips for Effective Financial Analysis in Excel
As you delve deeper into financial analysis, here are some tips to enhance your efficiency and accuracy. Excel provides numerous keyboard shortcuts that can save you time and reduce repetitive tasks. For example, pressing Ctrl+C and Ctrl+V allows you to quickly copy and paste data. Validating data inputs ensures the accuracy of your analysis by restricting the entry of incorrect or inconsistent data. By setting up validation rules, you can prevent errors and maintain data integrity.
Conclusion
Congratulations! You have embarked on a journey to become proficient in Excel financial analysis techniques. We have explored the essentials of Excel, from functions and data organisation to formula usage, visualisation, and advanced techniques. Armed with these skills, you can confidently uncover valuable insights for strategic decision making. Remember, practice makes perfect, so keep honing your Excel skills and applying them to real-world financial analysis scenarios. Excel truly is a game-changer in the world of finance, and I'm excited to see how it empowers you in your journey towards success!
Now go forth, unleash the power of Excel financial analysis techniques, and make strategic decisions with confidence!
If you're looking for 1-2-1 excel training so you can become an Excel wizard, head to our
contact page to book a FREE consultation.
Get in Touch
We will get back to you as soon as possible.
Please try again later.
We specialise in Advanced Excel training, Dashboard development, Data Analysis, Power BI and VBA. We also provide training with, both standard and customised courses to suit your organisation’s needs.
Quick Links
Address
2, 26 Linden Gardens London W2 4ES
Phone
07737 707 548
by SEO Local Services | All Rights Reserved | XLIntelligence


