How to get started with Power BI
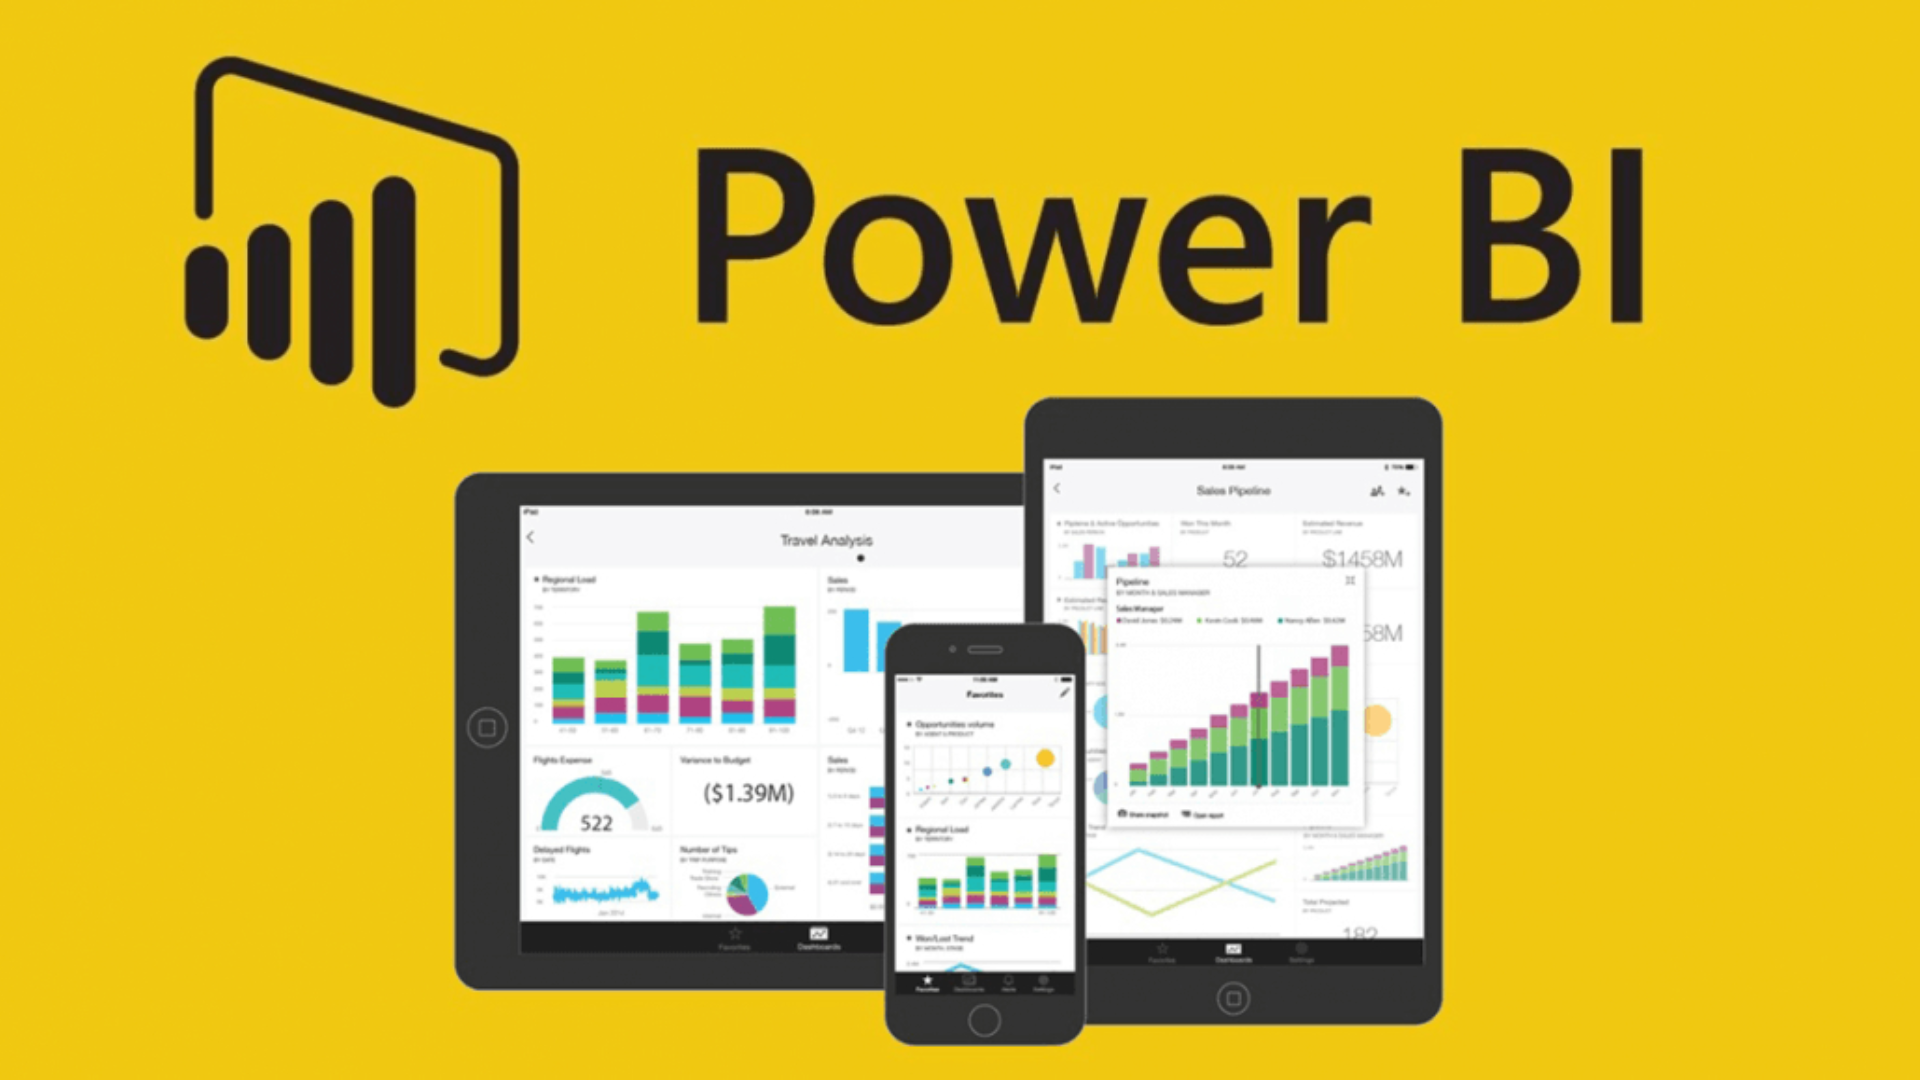
In today's data-driven world, businesses of all sizes rely on data analysis and visualisation tools to gain valuable insights and make informed decisions. Microsoft Power BI has emerged as one of the leading business intelligence tools, empowering users to transform raw data into interactive reports and dashboards. If you're new to Power BI and eager to learn how to create compelling visualisations, this beginner's guide from XL Intelligence will help you get started.
Understanding Power BI
Before diving into the world of Power BI, it's essential to grasp the basics. Power BI is a cloud-based business analytics tool that allows users to connect to various data sources, transform and cleanse the data, and create interactive visualisations, reports, and dashboards. It offers a user-friendly interface and robust functionalities that make it accessible to beginners and professionals alike.
Getting Started with Power BI
To begin your Power BI journey, you first need to download and install Power BI Desktop, the application used for creating reports and dashboards. Power BI Desktop is available for free from the Microsoft website. Once installed, you can launch the application and explore its features.
Connecting to Data Sources
Power BI allows you to connect to a wide range of data sources, including Excel spreadsheets, databases, online services, and more. To create interactive reports and dashboards, you need to connect to the relevant data source. Power BI provides a simple and intuitive interface for establishing these connections.
Transforming and Cleaning Data
Raw data often requires transformation and cleaning before it can be effectively visualized. Power BI offers a range of tools and functionalities to help you transform and shape your data. You can perform operations such as filtering, sorting, merging, and grouping to prepare your data for visualisation.
Creating Visualisations
One of the most powerful aspects of Power BI is its ability to create stunning visualisations. With a wide range of charts, graphs, and maps at your disposal, you can represent your data in an engaging and informative way. Power BI allows you to customise the appearance and formatting of visualisations to match your preferences and the needs of your audience.
Building Interactive Reports
Power BI enables you to go beyond static reports and create interactive experiences for your users. You can add slicers, filters, and drill-through actions to allow users to explore the data in more detail. Power BI also supports the creation of calculated fields and measures, which can further enhance the insights derived from your data.
Designing Dashboards
Dashboards provide an at-a-glance view of key metrics and KPIs. Power BI lets you combine multiple visualisations and reports into a single dashboard, offering a comprehensive overview of your data. You can arrange and customise the layout of your dashboard to highlight the most important information.
Sharing and Collaboration
Power BI allows you to share your reports and dashboards with others, either within your organisation or externally. You can publish your reports to the Power BI service, where you can control access and permissions for different users. Power BI also provides collaboration features, allowing multiple users to work together on a report or dashboard.
Power BI Mobile App
In addition to the desktop application, Power BI offers a mobile app that enables you to access your reports and dashboards on the go. The mobile app provides a responsive and optimised experience, allowing you to stay connected to your data wherever you are.
Power BI Community and Resources
As a beginner in Power BI, it's important to leverage the available resources and community support. Microsoft provides comprehensive documentation, tutorials, and video courses to help you learn and master Power BI. Additionally, the Power BI community forums and user groups offer a platform to ask questions, continue your learning journey, and connect with fellow Power BI enthusiasts.
Power BI is a powerful tool for creating interactive reports and dashboards that enable data-driven decision-making. This beginner's guide has provided an overview of the key steps and features involved in using Power BI effectively. By understanding the basics of Power BI, connecting to data sources, transforming and cleaning data, creating visualisations, building interactive reports, designing dashboards, and leveraging sharing and collaboration features, you can unlock the full potential of this business intelligence tool.
Remember to explore the Power BI community and available resources to enhance your learning experience. As you delve deeper into Power BI, you will discover advanced features and techniques that can further enhance your data analysis and visualisation skills.
Whether you are a business professional, analyst, or data enthusiast, Power BI offers a user-friendly and versatile platform to unlock insights from your data. So, don't hesitate to embark on your Power BI journey and unleash the power of data visualisation for informed decision-making.
Start exploring Power BI today, and witness how it can transform raw data into compelling visualisations that drive business success.
If you’re still not sure where to start with Power BI, book a FREE Power BI training consultation today by visiting our
contact us page.
Get in Touch
We will get back to you as soon as possible.
Please try again later.
We specialise in Advanced Excel training, Dashboard development, Data Analysis, Power BI and VBA. We also provide training with, both standard and customised courses to suit your organisation’s needs.
Quick Links
Address
2, 26 Linden Gardens London W2 4ES
Phone
07737 707 548
by SEO Local Services | All Rights Reserved | XLIntelligence


