Excel advanced data analysis techniques

In the realm of modern data analysis, Excel stands as a steadfast companion, aiding professionals in uncovering intricate insights from complex datasets. The capabilities of this ubiquitous spreadsheet software reach far beyond basic arithmetic functions, offering a myriad of advanced data analysis techniques. At XL Intelligence, we delve into these techniques to empower you with the tools to unravel the true potential of your data.
Understanding Advanced Data Analysis in Excel
At its core, advanced data analysis in Excel involves harnessing its intricate functions and tools to glean profound insights from raw data. This goes beyond simple data manipulation; it's about transforming data into meaningful information that guides crucial decision-making. Excel's vast array of features enables users to perform tasks such as complex calculations, data visualisation, optimisation, and more.
Key Excel Formulas for Advanced Data Analysis
Excel formulas are the foundation upon which advanced data analysis is built. They allow us to process and manipulate data efficiently. Some key formulas worth mastering include:
- INDEX-MATCH: This dynamic duo replaces the traditional VLOOKUP and HLOOKUP functions, offering flexibility and speed in data retrieval.
- SUMIFS and COUNTIFS: These functions perform conditional sums and counts, allowing you to extract specific data subsets based on multiple criteria.
- AVERAGEIFS: Calculate the average of data that meets certain criteria, providing deeper insights into your data.
- IFERROR: Handle errors elegantly by replacing them with custom messages or values, ensuring data accuracy.
These formulas can significantly streamline your data analysis process, saving time and reducing errors.
Applying Conditional Formatting for Data Visualisation
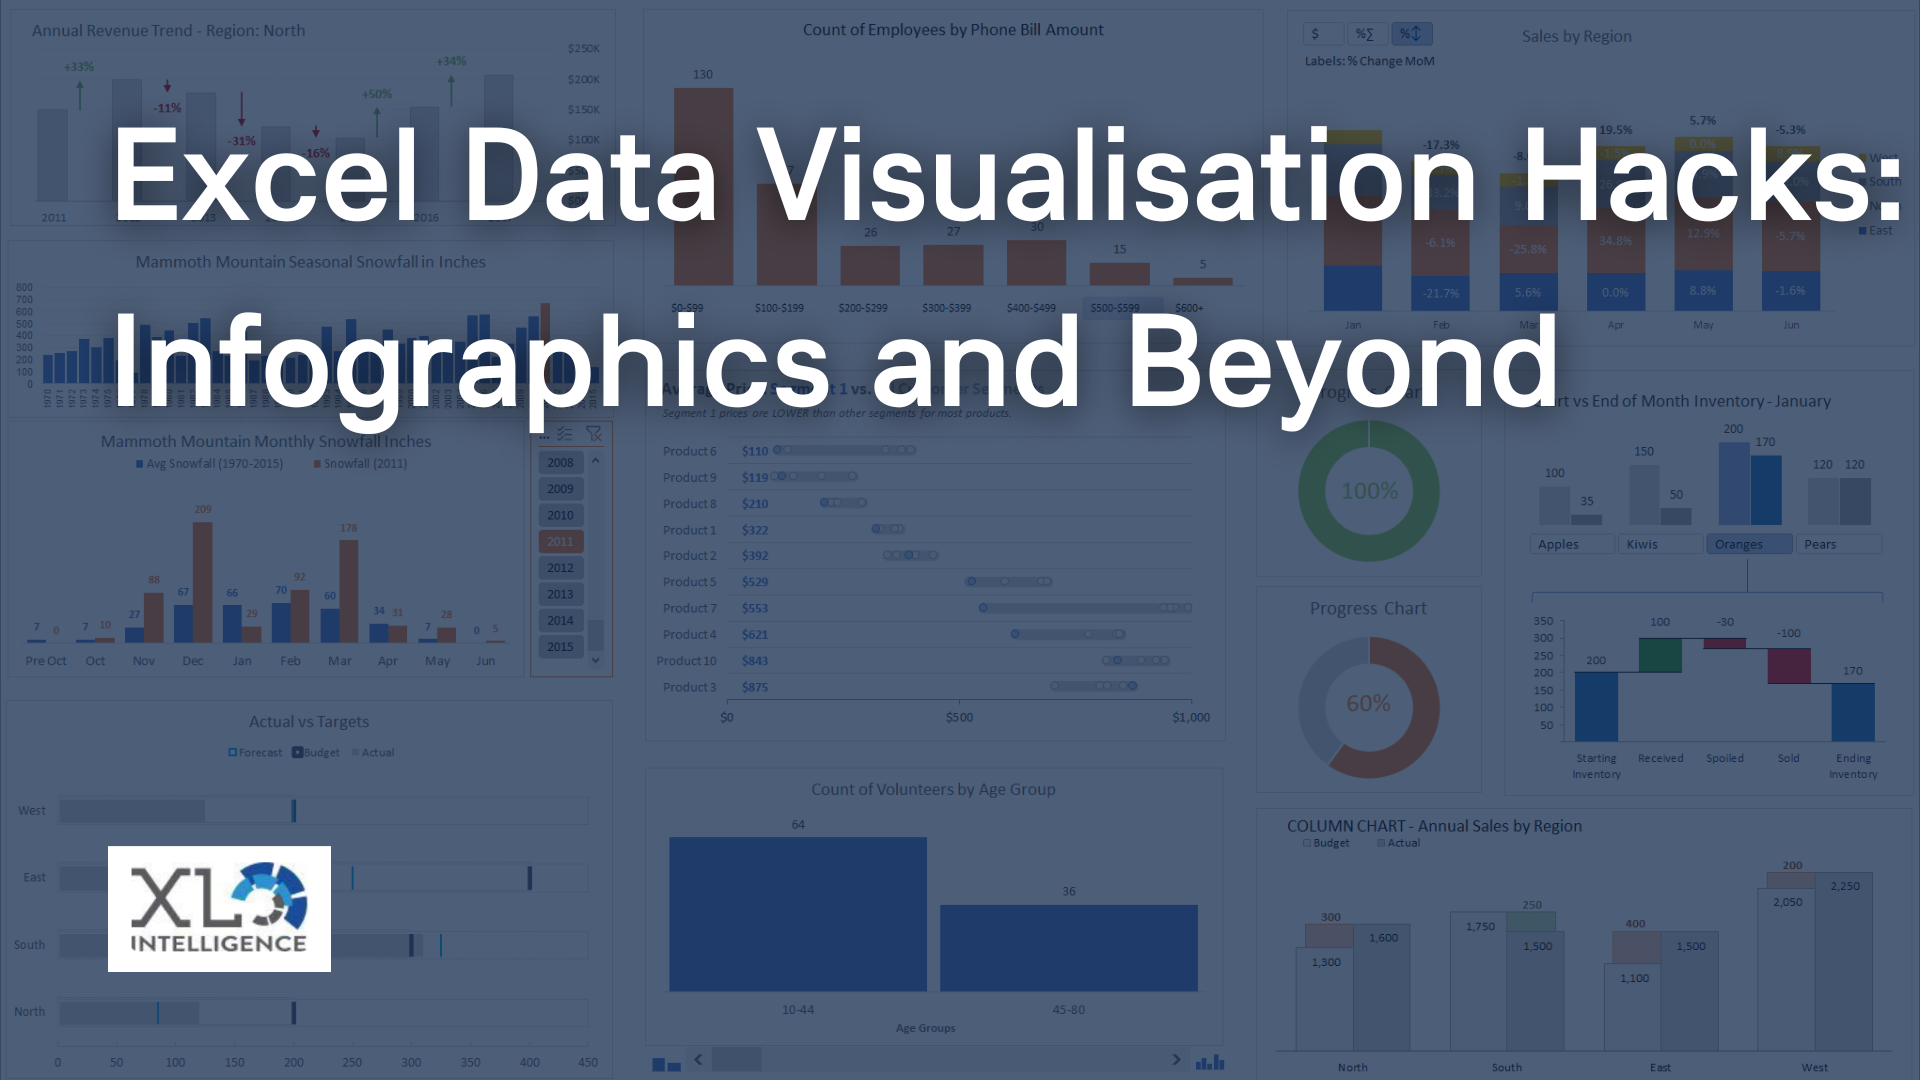
Data visualisation plays a pivotal role in conveying insights effectively. Excel's conditional formatting feature empowers you to visually highlight trends and patterns in your data. For instance, using colour scales to represent data ranges can make temperature variations or performance levels instantly recognisable.
Personal Anecdote: One of our data analysts, Sarah, found that using conditional formatting on a large sales dataset brought attention to unexpected spikes in sales during specific months. This insight led to a deeper investigation and the discovery of a previously overlooked marketing campaign's impact.
PivotTables and PivotCharts for Comprehensive Insights
Excel's PivotTables and PivotCharts are powerhouse tools for summarising and analysing vast datasets. PivotTables allow you to segment and aggregate data effortlessly, while PivotCharts provide visual representations of your summarised data. Proper data structuring is key to getting the most out of these tools.
Advanced Charting Techniques
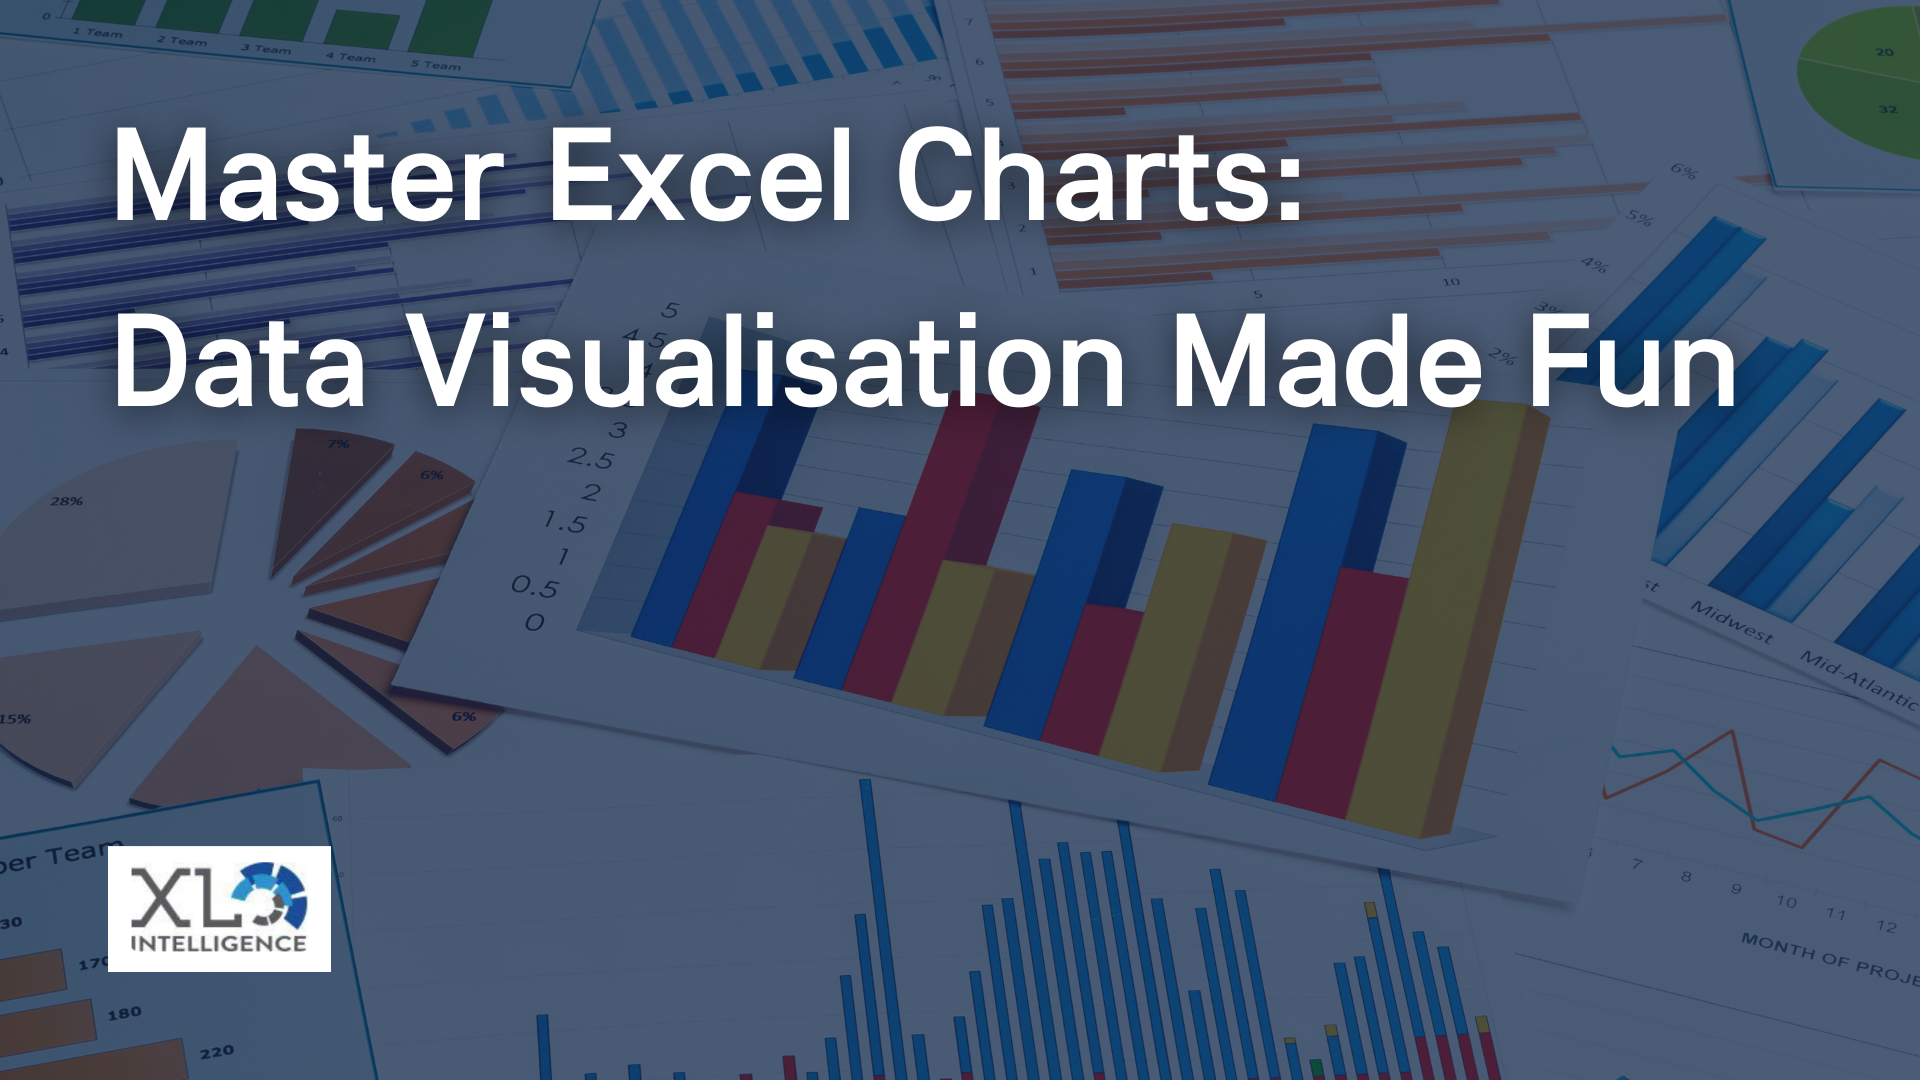
Diving further into data visualisation, advanced charting techniques offer a richer understanding of complex datasets. Waterfall charts depict incremental changes over time, Gantt charts offer project management insights, and scatter plots reveal relationships between variables.
Solver Tool for Optimisation and What-If Analysis
Excel's Solver tool is an unsung hero for optimization problems. Whether it's determining the optimal production mix or resource allocation, Solver can find solutions by adjusting variables while respecting constraints. Moreover, it aids in "What-If" analysis, allowing you to explore different scenarios and their outcomes.
Power Query: Transforming and Cleaning Data
Data isn't always presented in the most usable form. Enter Power Query, a versatile tool for data transformation and cleaning. Connect to external data sources, reshape data, and ensure accuracy before analysis. This tool saves precious time that might otherwise be spent on manual data manipulation.
Harnessing the Power of Array Formulas
Array formulas are Excel's hidden gems for intricate calculations. These formulas operate on arrays of data, performing multiple calculations at once. They're efficient for tasks like calculating dynamic ranges or performing multi-condition calculations.
Building Interactive Dashboards with Excel
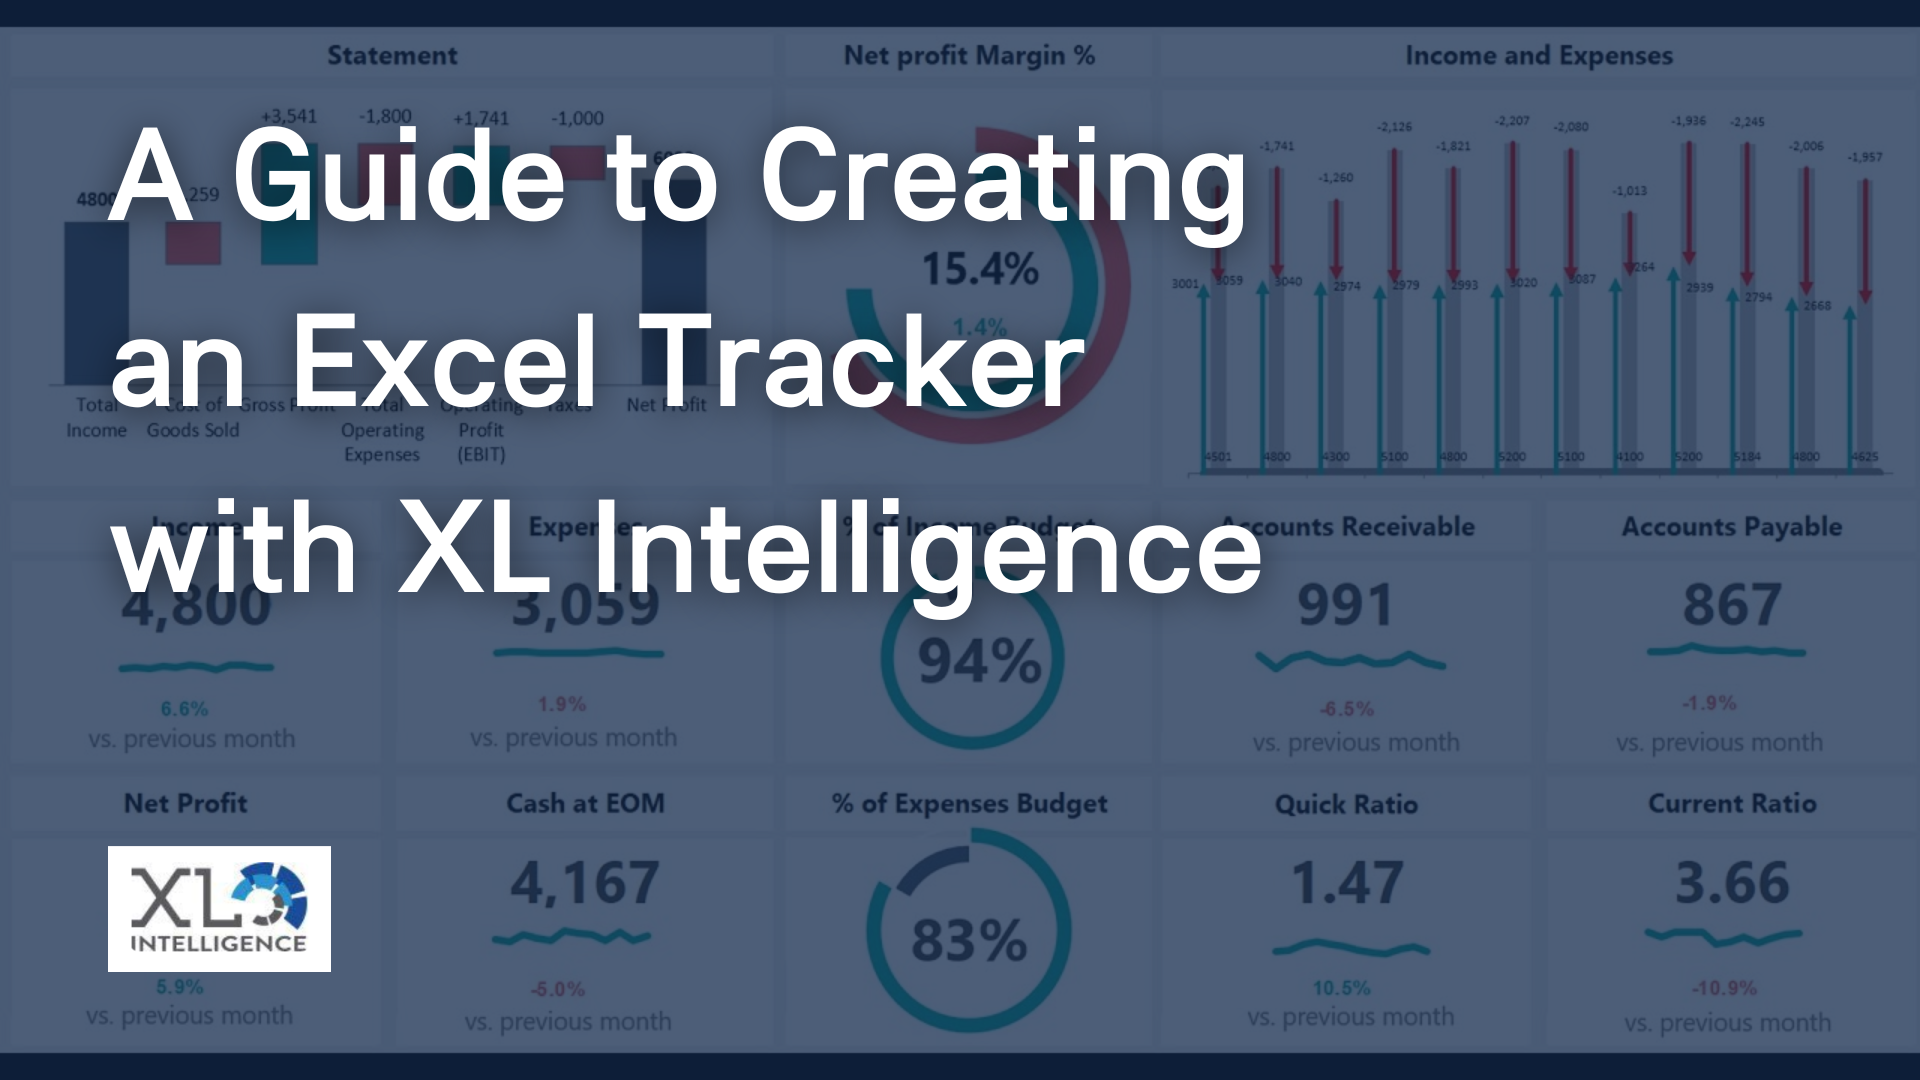
Interactive dashboards empower stakeholders to explore data on their own terms. By incorporating features like slicers and data validation, you can create user-friendly interfaces that allow users to customise their data views.
Real-World Case Studies
In real-world scenarios, applying advanced Excel techniques can yield remarkable results. For instance, a manufacturing company optimised their production schedule using Solver, increasing efficiency by 15%. Another instance involved using PivotTables to identify target market segments, resulting in a 20% boost in marketing ROI.
Conclusion
In a data-driven world, mastering advanced Excel techniques is a formidable advantage. From complex formulas to sophisticated visualisations, these tools transform data into insights that drive strategic decisions. XL Intelligence encourages you to embark on this journey of discovery. Elevate your data analysis game, unravel hidden trends, and make informed choices that propel your success.
Ready to Unlock Excel's Full Potential? Take the first step towards mastering advanced data analysis techniques in Excel. Visit our contact page at www.xlintelligence.com/contact to learn more about our services and how we can assist you in harnessing the power of Excel for unparalleled data insights.
Get in Touch
We will get back to you as soon as possible.
Please try again later.
We specialise in Advanced Excel training, Dashboard development, Data Analysis, Power BI and VBA. We also provide training with, both standard and customised courses to suit your organisation’s needs.
Quick Links
Address
2, 26 Linden Gardens London W2 4ES
Phone
07737 707 548
by SEO Local Services | All Rights Reserved | XLIntelligence


